
ETF Tracker StatSheet
You can view the latest version here.
SLUMPING INTO THE WEEKEND
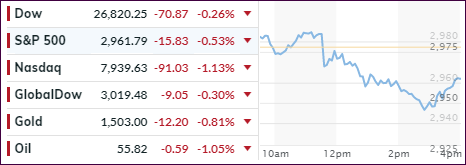
- Moving the markets
An early 100-point gain on the Dow evaporated in a hurry and turned into a 150-point loss at one point, after a report that the White House had thrown down the gauntlet by contemplating delisting Chinese stocks from US Exchanges.
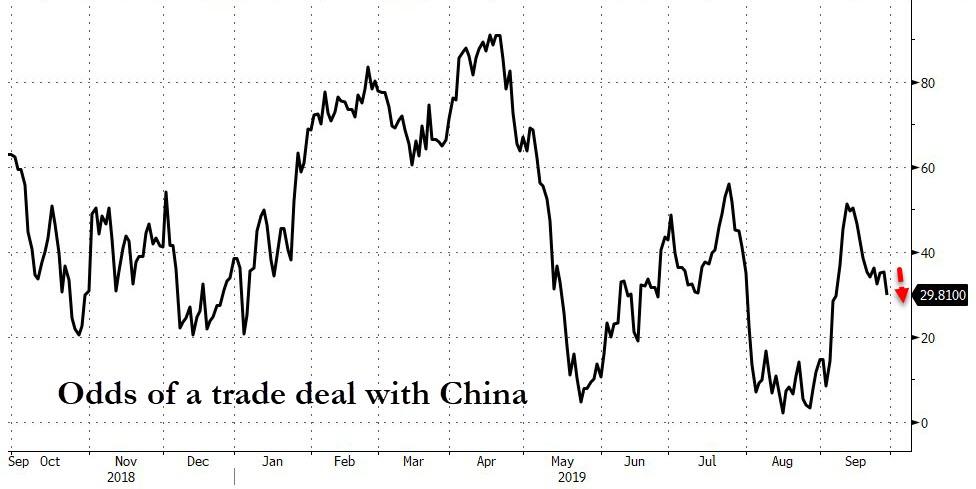
Of course, such a crackdown on capital flows does not bode well for softening the intensity of the tariff battle being waged. This news comes in the face of the warring parties having set an Oct. 10-11 date to meet to resolve their trade differences. I don’t see how this ratcheting up of tensions will be of any value but, it could be simply a negotiation ploy. In the end, the odds of a China deal slipped this week.
Economic data points were mixed with consumer spending growth showing disappointing estimates, while orders for durable goods rose 0.2% in August vs. expectations of a 0.7% decline. But the consumer sentiment was revised upwards in September from 92 to 93.2, however, the index remains on a downward trajectory.
On the week, equities fell with Small Caps leading the drop and having its worst week since May 2019. As ZH pointed out, all the major indexes tested or broke below key technical levels: The Nasdaq below 50 and 100 DMA; Russell 2000 below 200 DMA; S&P testing 50 DMA.
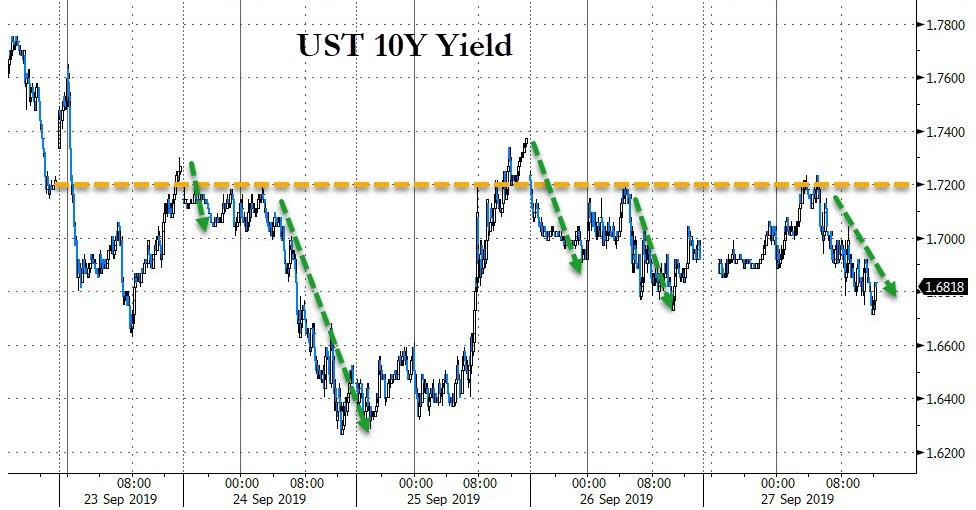
10-year yields attempted several times to break out above the 1.70% level, but the efforts were rebuffed, and we closed the week around the 1.68% area.
This was the second losing week in a row for the S&P 500, but it’s still hanging on to a gain for the month. For sure, it looks like a very positive trade headline is needed next week to get the bulls going again.
2. ETFs in the Spotlight
In case you missed the announcement and description of this section, you can read it here again.
It features 10 broadly diversified and sector ETFs from my HighVolume list as posted every Saturday. Furthermore, they are screened for the lowest MaxDD% number meaning they have been showing better resistance to temporary sell offs than all others over the past year.
The below table simply demonstrates the magnitude with which some of the ETFs are fluctuating regarding their positions above or below their respective individual trend lines (%+/-M/A). A break below, represented by a negative number, shows weakness, while a break above, represented by a positive percentage, shows strength.
For hundreds of ETF choices, be sure to reference Thursday’s StatSheet.
For this current domestic “Buy” cycle, here’s how some our candidates have fared:
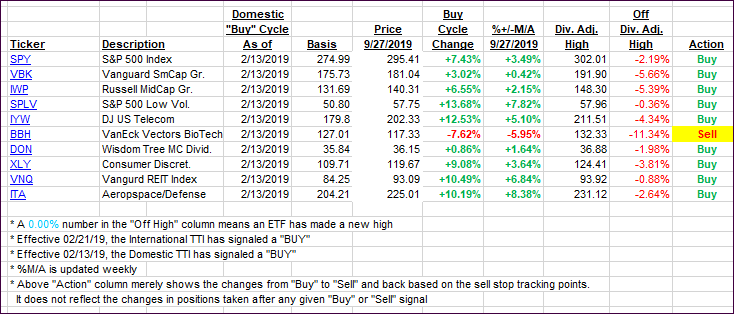
Again, the %+/-M/A column above shows the position of the various ETFs in relation to their respective long-term trend lines, while the trailing sell stops are being tracked in the “Off High” column. The “Action” column will signal a “Sell” once the -8% point has been taken out in the “Off High” column. For more volatile sector ETFs, the trigger point is -10%.
3. Trend Tracking Indexes (TTIs)
Our Trend Tracking Indexes (TTIs) slipped again with negative trade headlines giving the bears the upper hand.
Here’s how we closed 09/27/2019:
Domestic TTI: +3.49% above its M/A (prior close +4.07%)—Buy signal effective 02/13/2019
International TTI: +0.66% above its M/A (prior close +1.18%)—Buy signal effective 09/12/2019
Disclosure: I am obliged to inform you that I, as well as my advisory clients, own some of the ETFs listed in the above table. Furthermore, they do not represent a specific investment recommendation for you, they merely show which ETFs from the universe I track are falling within the specified guidelines.
———————————————————-
WOULD YOU LIKE TO HAVE YOUR INVESTMENTS PROFESSIONALLY MANAGED?
Do you have the time to follow our investment plans yourself? If you are a busy professional who would like to have his portfolio managed using our methodology, please contact me directly or get more details here.
———————————————————
Back issues of the ETF Tracker are available on the web.
Contact Ulli