Below, please find the latest High-Volume ETF Cutline
report, which shows how far above or below their respective long-term trend
lines (39-week SMA) my currently tracked ETFs are positioned.
This report covers the HV ETF Master List from Thursday’s
StatSheet and includes 322 High Volume ETFs, defined as those with an average
daily volume of more than $5 million, of which currently 276 (last week 267)
are hovering in bullish territory. The yellow line separates those ETFs that
are positioned above their trend line (%M/A) from those that have dropped below
it.
In case you are not familiar
with some of the terminology used in the reports, please read the Glossary of Terms.
If you missed the original
post about the Cutline approach, you can read it here.
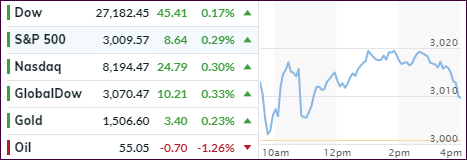
EDGING HIGHER ON HOPE FOR U.S.-CHINA TRADE PROGRESS
[Chart courtesy of MarketWatch.com]
Moving
the markets
While
the major indexes traded above their respective unchanged lines throughout the session,
a late push higher appeared to put an exclamation mark at the end of the day,
as if to imply that the U.S.-China talks better result in a positive outcome.
Still,
the gains were modest, as traders are anxiously awaiting tomorrow’s meeting between
Trump and Xi in Japan as part of the G-20 powwow. With threats and conditions
having been thrown back and forth, I don’t see much headway being made. After
all, for Trump to declare that he made the best trade deal ever, the Chinese would
have to admit defeat, and that is not going to happen.
In
the end, the month of June proved to be the “comeback” month of the year with
the S&P 500 gaining some +6.87%, its best performance since 1955. While
that sounds great on the surface, let’s not forget that the index lost -6.59%
in May. In other words, we’re about back to where we were on April 30th,
namely 2,946 vs. today’s close of 2,941.
Looking
at a bigger time frame, like the past 17 months, we see in the following chart that
the S&P 500 peaked at 2,873 in February 2018 and closed today at 2,941. That
is a jaw dropping return of +2.37%:
1. From the universe of over 1,800 ETFs, I have selected only those with a
trading volume of over $5 million per day (HV ETFs), so that liquidity and a
small bid/ask spread are assured.
2. Trend Tracking Indexes (TTIs)
Buy or Sell decisions for Domestic and International ETFs (section 1 and
2), are made based on the respective TTI and its position either above or below
its long-term M/A (Moving Average). A crossing of the trend line from below
accompanied by some staying power above constitutes a “Buy” signal. Conversely,
a clear break below the line constitutes a “Sell” signal. Additionally, I use a
7.5% trailing stop loss on all positions in these categories to control
downside risk.
3. All other investment arenas do not have a TTI and should be traded
based on the position of the individual
ETF relative to its own respective trend line (%M/A). That’s why those signals
are referred to as a “Selective Buy.” In other words, if an ETF crosses its own
trendline to the upside, a “Buy” signal is generated. Since these areas tend to
be more volatile, I recommend a wider trailing sell stop of 7.5% -10% depending
on your risk tolerance.
If you are unfamiliar with some of the terminology, please see Glossary of Termsand new subscriber information in section 9.
1. DOMESTIC EQUITY ETFs: BUY
— since 02/13/2019
Click on chart to enlarge
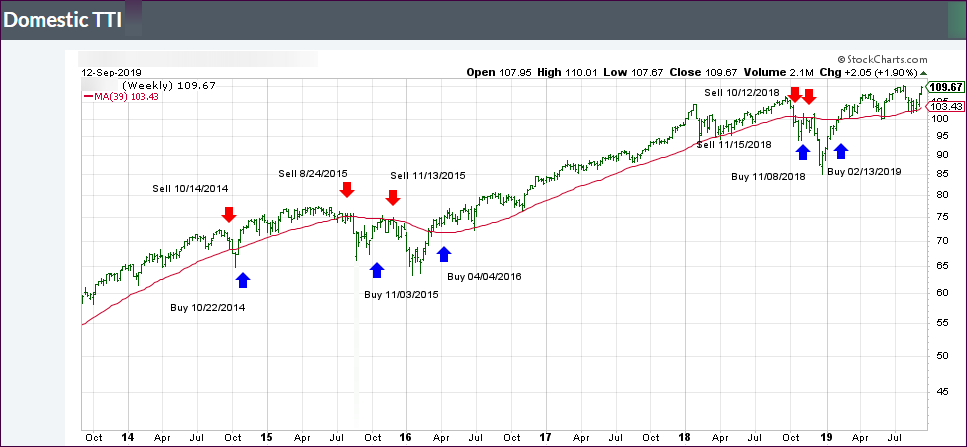
Our main directional indicator, the Domestic Trend Tracking Index (TTI-green line in the above chart) is now positioned above its long-term trend line (red) by +5.37% after having generated a new Domestic “Buy” signal effective 2/13/19 as posted.
Boeing put a dent into the Dow’s performance today, which
lagged as a result of news that the 737 MAX airplane has a “glitch” that could
send it into an “uncontrollable” nosedive. That sent the shares tumbling early on,
but they ended up stabilizing and finishing with a minor loss of some -2.5%.
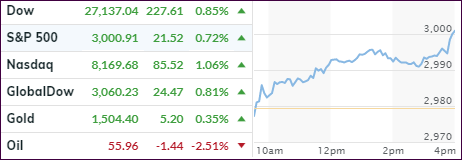
The other two major indexes managed to close in the green
with the S&P 500 finally rising after four days of declines. Still, the
index is on track to have its best month since January, after the rout in May during
which it tanked -6.6%.
Throughout the session, the Nasdaq and S&P managed to
hold steady, despite more shaky economic news. We learned that Pending Home
Sales on a YoY basis contracted by -0.8% despite lower mortgage rates, but they
surprised to the upside in May (+1.1%).
In the automobile sector, the ‘carmageddon’ continues with
Ford announcing some 12,000 layoffs at various manufacturing plants in Europe.
This is part of a massive cost cutting plan that would also shutter 6 of its 24
facilities by the end of 2000.
Here in the US, traders are nervously awaiting the
outcome of the G-20 meeting, mainly regarding a possible trade deal with China,
as the jawboning between the warring parties has shifted into high gear.
It’s a different day, but the same old threats of pre-conditions
and additional tariffs. We’ll find out initial market reaction on Sunday night,
when the futures markets open.
I had to laugh this morning, when I saw the early market
spike explained as having been a grammatical error. According to an early CNBC headline
saying that Treasury Secretary Mnuchin said a trade deal “IS” 90%
complete, and repeated by Bloomberg, pushed the computer algos into buying mode.
As it turned out, CNBC made an error, because instead of
saying “is,” Mnuchin was actually using the past tense and said that we “were”
about 90% on the way to a China trade deal. Ouch! Therefore, the early buying spree
turned into a false
alarm with the algos back peddling and the market slipping and sliding into
the close.
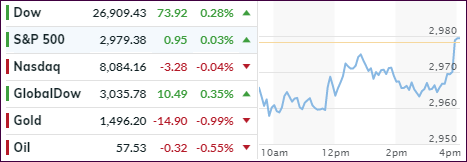
In the end, not much was gained, expect the Nasdaq closed
in the green, thanks to a 14% pop in Micron stock.
Not helping matters was a sudden jump in bond yields with
the 10-year
gaining 6 basis points to close back above the 2% level. As a result, the low volatility
ETF SPLV, which we own, had a down day, but it remains ahead of SPY for this domestic
‘Buy’ cycle.
With the widely anticipated G-20 meeting on deck for this
weekend, I expect market direction to be predominantly sideways for the next
couple of days. For sure, we’re bound to see more clarity this coming Monday.
While equity markets can’t get enough dovishness from the
Fed, to keep the rally going, today we saw some disappointment kick in, as traders
translated the Fed’s comments as too hawkish.
Fed chief Powell offered a “wait-and-see” posture on interest
rates, which means that they prefer to continue monitoring the economy for signs
of weakness, in order to avoid a knee-jerk reaction in terms of cutting
interest rates. He also added that he won’t bow to political pressure.
If that wasn’t a rally killer, the St. Louis Fed head
Bullard chimed in by opining that he is not in favor of a ½ point rate cut in
July. Ouch! That hurt, because expectations had been 40% and subsequently collapsed
to 16% before moving back up to 26%.
Reuters reported that no broad trade deal was expected at the upcoming meeting and that talks could take months, years to complete.
Consumer Confidence dropped to 2-year lows, New Home Sales crashed -7.8% in May to the weakest since 2018, which was a surprise as expectations saw a 1.6% MoM rise.
The Case-Shiller Home Price Appreciation index showed a slowdown for the 13th straight month.
So, it was no surprise for the 10-year bond yield to tumble
below the 2% level, and it closed slightly below it confirming that an economic
slowdown
has arrived or is in the making.
What was a surprise to me was the fact that the equity markets
did not drop more than they did given that there was no positive news?
With the 0.5% expected July interest rate drop endangered
at this time, ZH posted the question “if the Fed does not pay up and give in
to the market’s demands, will the jaws
of death snap shut?”