
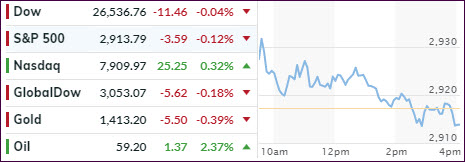
1. Moving the markets
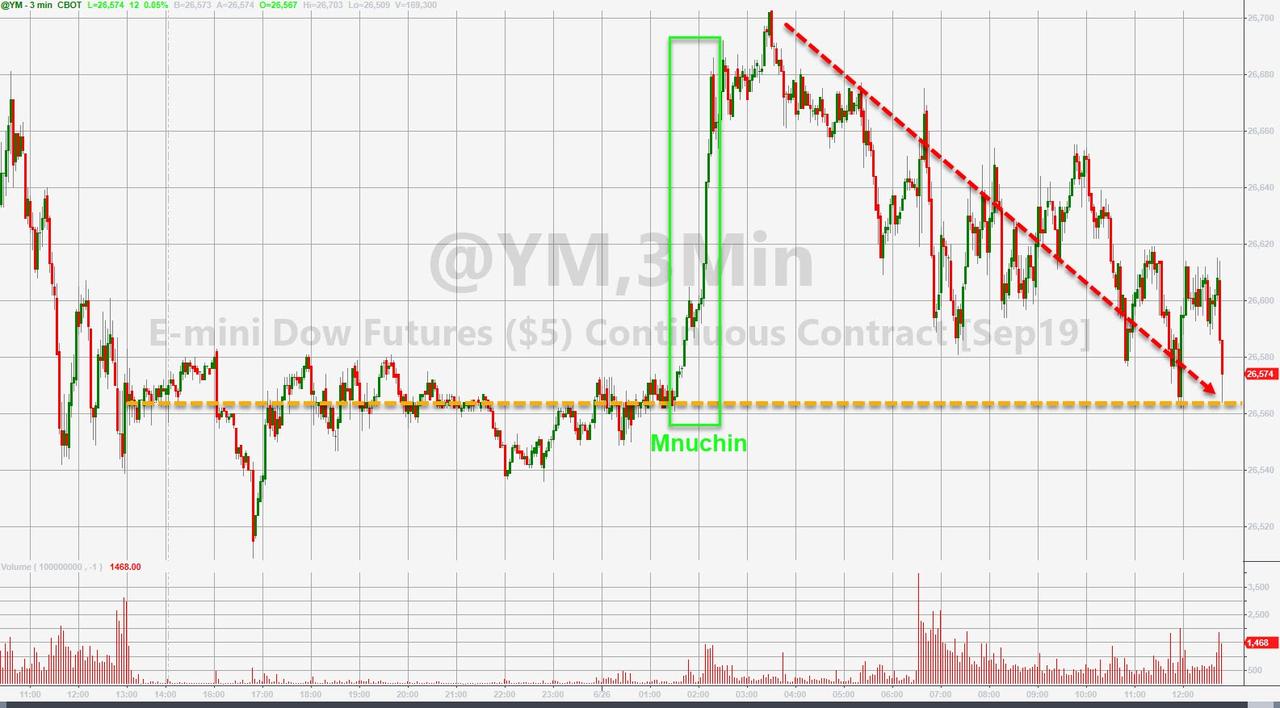
I had to laugh this morning, when I saw the early market spike explained as having been a grammatical error. According to an early CNBC headline saying that Treasury Secretary Mnuchin said a trade deal “IS” 90% complete, and repeated by Bloomberg, pushed the computer algos into buying mode.
As it turned out, CNBC made an error, because instead of saying “is,” Mnuchin was actually using the past tense and said that we “were” about 90% on the way to a China trade deal. Ouch! Therefore, the early buying spree turned into a false alarm with the algos back peddling and the market slipping and sliding into the close.
In the end, not much was gained, expect the Nasdaq closed in the green, thanks to a 14% pop in Micron stock.
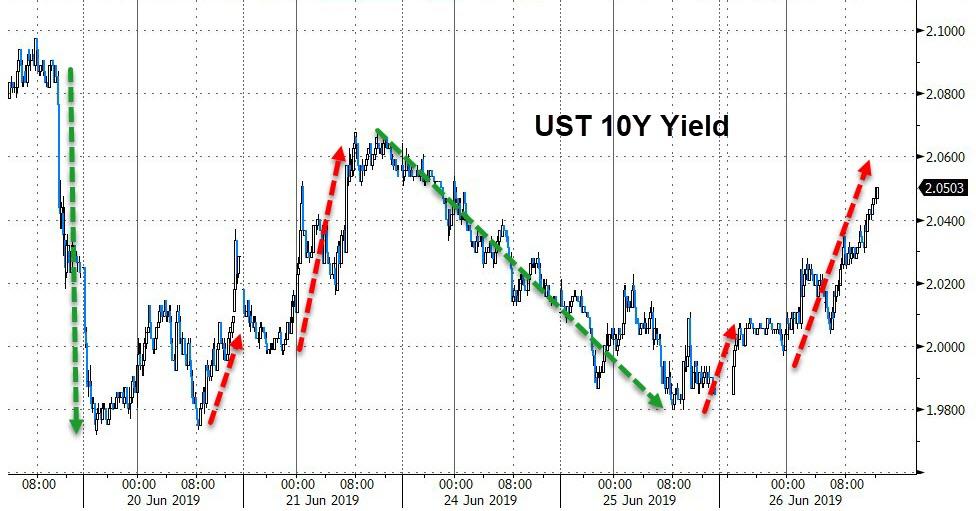
Not helping matters was a sudden jump in bond yields with the 10-year gaining 6 basis points to close back above the 2% level. As a result, the low volatility ETF SPLV, which we own, had a down day, but it remains ahead of SPY for this domestic ‘Buy’ cycle.
With the widely anticipated G-20 meeting on deck for this weekend, I expect market direction to be predominantly sideways for the next couple of days. For sure, we’re bound to see more clarity this coming Monday.
2. ETFs in the Spotlight
In case you missed the announcement and description of this section, you can read it here again.
It features 10 broadly diversified and sector ETFs from my HighVolume list as posted every Saturday. Furthermore, they are screened for the lowest MaxDD% number meaning they have been showing better resistance to temporary sell offs than all others over the past year.
The below table simply demonstrates the magnitude with which some of the ETFs are fluctuating regarding their positions above or below their respective individual trend lines (%+/-M/A). A break below, represented by a negative number, shows weakness, while a break above, represented by a positive percentage, shows strength.
For hundreds of ETF choices, be sure to reference Thursday’s StatSheet.
For this current domestic “Buy” cycle, here’s how some our candidates have fared:
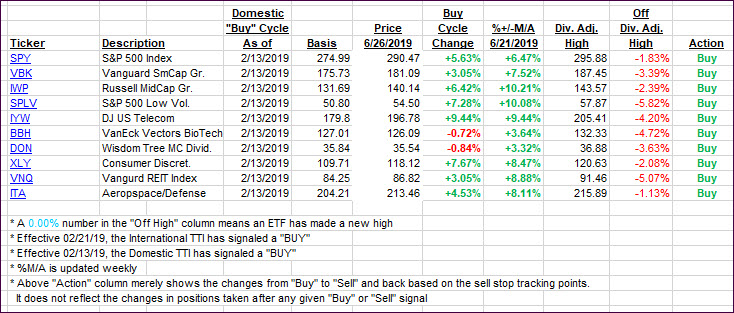
Again, the %+/-M/A column above shows the position of the various ETFs in relation to their respective long-term trend lines, while the trailing sell stops are being tracked in the “Off High” column. The “Action” column will signal a “Sell” once the -8% point has been taken out in the “Off High” column. For more volatile sector ETFs, the trigger point is -10%.
3. Trend Tracking Indexes (TTIs)
Our Trend Tracking Indexes (TTIs) slipped again, as the markets went nowhere.
Here’s how we closed 06/26/2019:
Domestic TTI: +4.71% above its M/A (last close +4.88%)—Buy signal effective 02/13/2019
International TTI: +3.35% above its M/A (last close +3.54%)—Buy signal effective 06/19/2019
Disclosure: I am obliged to inform you that I, as well as my advisory clients, own some of the ETFs listed in the above table. Furthermore, they do not represent a specific investment recommendation for you, they merely show which ETFs from the universe I track are falling within the specified guidelines.
Contact Ulli