
1. Moving the markets
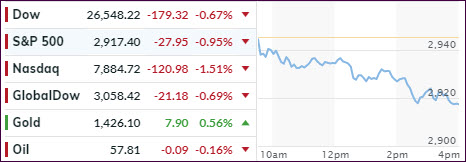
While equity markets can’t get enough dovishness from the Fed, to keep the rally going, today we saw some disappointment kick in, as traders translated the Fed’s comments as too hawkish.
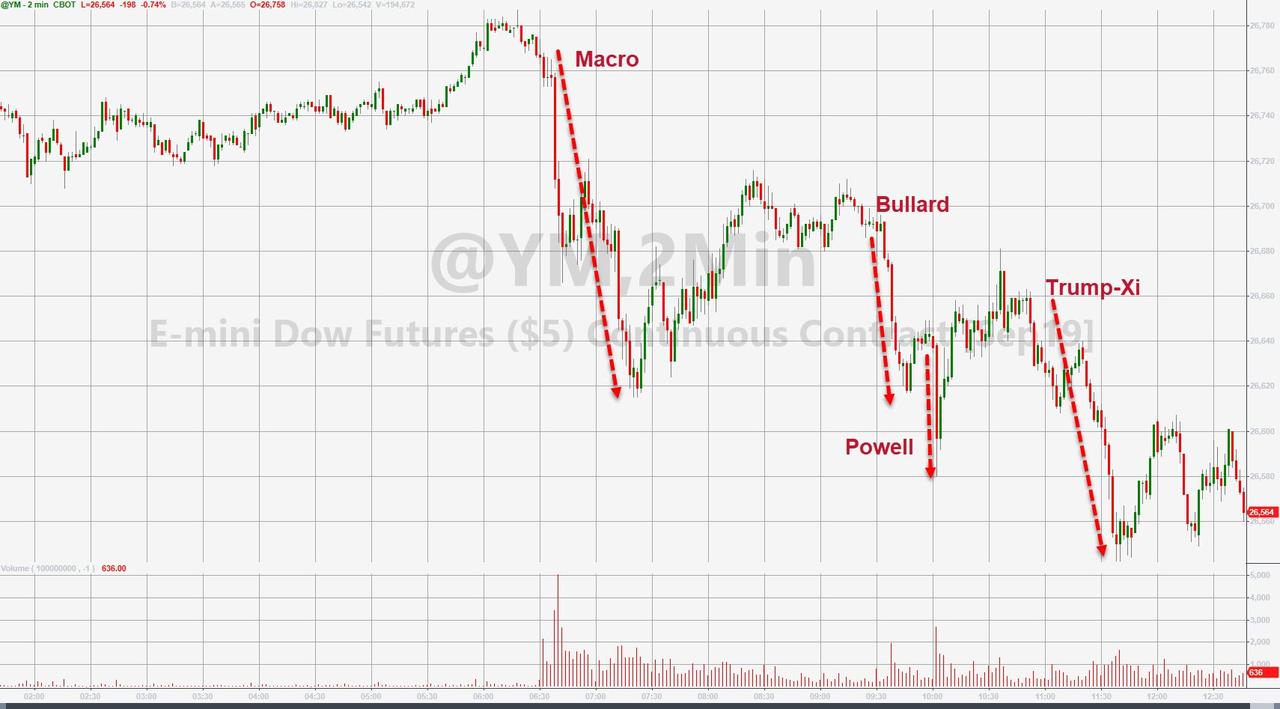
Fed chief Powell offered a “wait-and-see” posture on interest rates, which means that they prefer to continue monitoring the economy for signs of weakness, in order to avoid a knee-jerk reaction in terms of cutting interest rates. He also added that he won’t bow to political pressure.
If that wasn’t a rally killer, the St. Louis Fed head Bullard chimed in by opining that he is not in favor of a ½ point rate cut in July. Ouch! That hurt, because expectations had been 40% and subsequently collapsed to 16% before moving back up to 26%.
And the hits kept coming:
- Reuters reported that no broad trade deal was expected at the upcoming meeting and that talks could take months, years to complete.
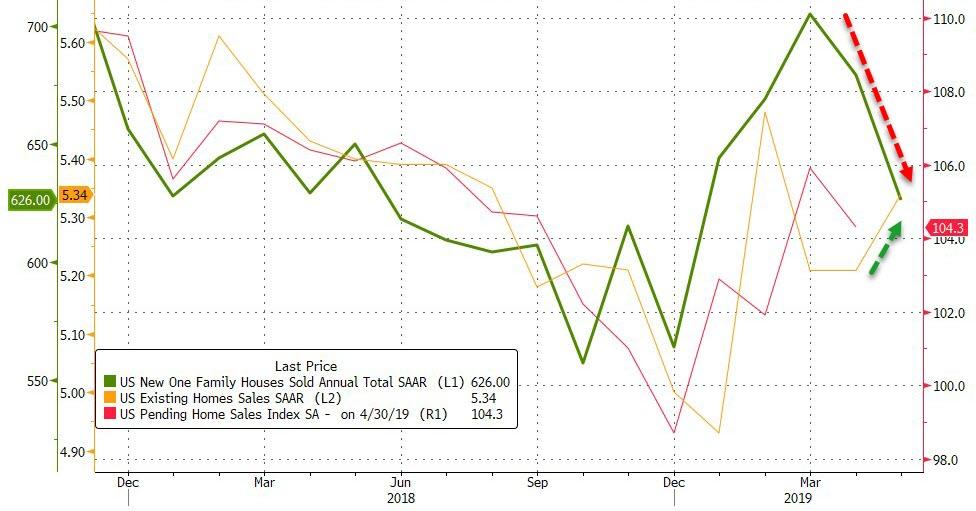
- Consumer Confidence dropped to 2-year lows, New Home Sales crashed -7.8% in May to the weakest since 2018, which was a surprise as expectations saw a 1.6% MoM rise.
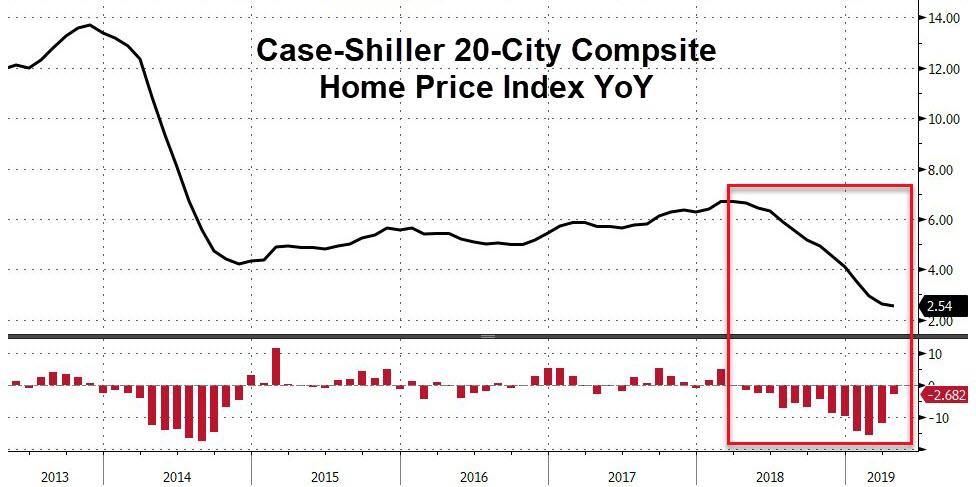
- The Case-Shiller Home Price Appreciation index showed a slowdown for the 13th straight month.
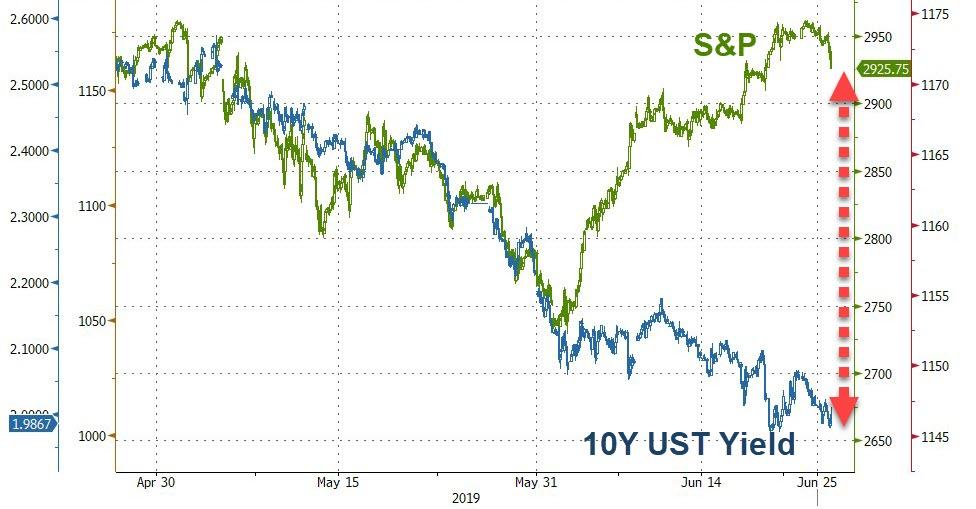
So, it was no surprise for the 10-year bond yield to tumble below the 2% level, and it closed slightly below it confirming that an economic slowdown has arrived or is in the making.
What was a surprise to me was the fact that the equity markets did not drop more than they did given that there was no positive news?
With the 0.5% expected July interest rate drop endangered at this time, ZH posted the question “if the Fed does not pay up and give in to the market’s demands, will the jaws of death snap shut?”
2. ETFs in the Spotlight
In case you missed the announcement and description of this section, you can read it here again.
It features 10 broadly diversified and sector ETFs from my HighVolume list as posted every Saturday. Furthermore, they are screened for the lowest MaxDD% number meaning they have been showing better resistance to temporary sell offs than all others over the past year.
The below table simply demonstrates the magnitude with which some of the ETFs are fluctuating regarding their positions above or below their respective individual trend lines (%+/-M/A). A break below, represented by a negative number, shows weakness, while a break above, represented by a positive percentage, shows strength.
For hundreds of ETF choices, be sure to reference Thursday’s StatSheet.
For this current domestic “Buy” cycle, here’s how some our candidates have fared:
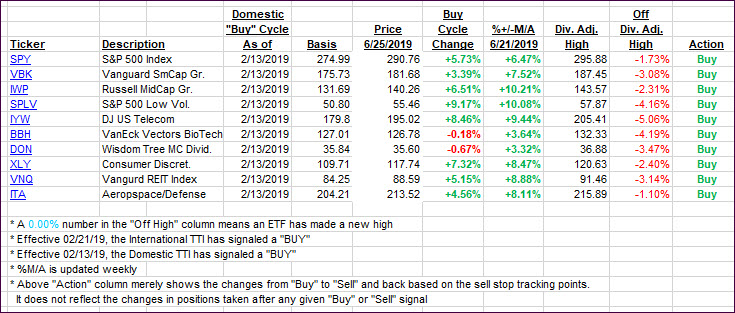
Again, the %+/-M/A column above shows the position of the various ETFs in relation to their respective long-term trend lines, while the trailing sell stops are being tracked in the “Off High” column. The “Action” column will signal a “Sell” once the -8% point has been taken out in the “Off High” column. For more volatile sector ETFs, the trigger point is -10%.
3. Trend Tracking Indexes (TTIs)
Our Trend Tracking Indexes (TTIs) headed south as bad news was accepted by the markets as bad news.
Here’s how we closed 06/25/2019:
Domestic TTI: +4.88% above its M/A (last close +5.52%)—Buy signal effective 02/13/2019
International TTI: +3.54% above its M/A (last close +4.25%)—Buy signal effective 06/19/2019
Disclosure: I am obliged to inform you that I, as well as my advisory clients, own some of the ETFs listed in the above table. Furthermore, they do not represent a specific investment recommendation for you, they merely show which ETFs from the universe I track are falling within the specified guidelines.
Contact Ulli