
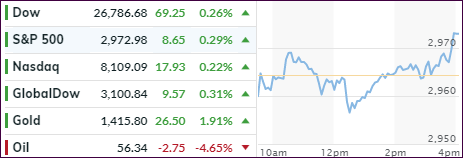
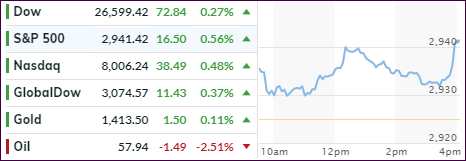
- Moving the markets
Moving around their respective unchanged lines was the motto of the day, as fading optimism from the trade ceasefire kept bullish momentum in check. However, in a repeat performance of yesterday, sudden buying pressure during the last hour prevented the major indexes from closing in the red, despite the short-squeeze having run out of ammo.
While trade negotiations have begun again, “this will take time, and we want to get it right,” said White House economic advisor Peter Navarro. In other words, there are no low hanging fruit to pick, and the markets will have to wait until positive news will provide a springboard for further equity advances.
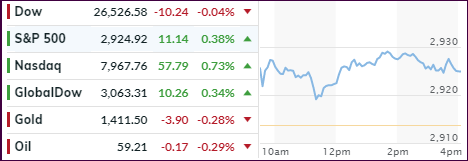
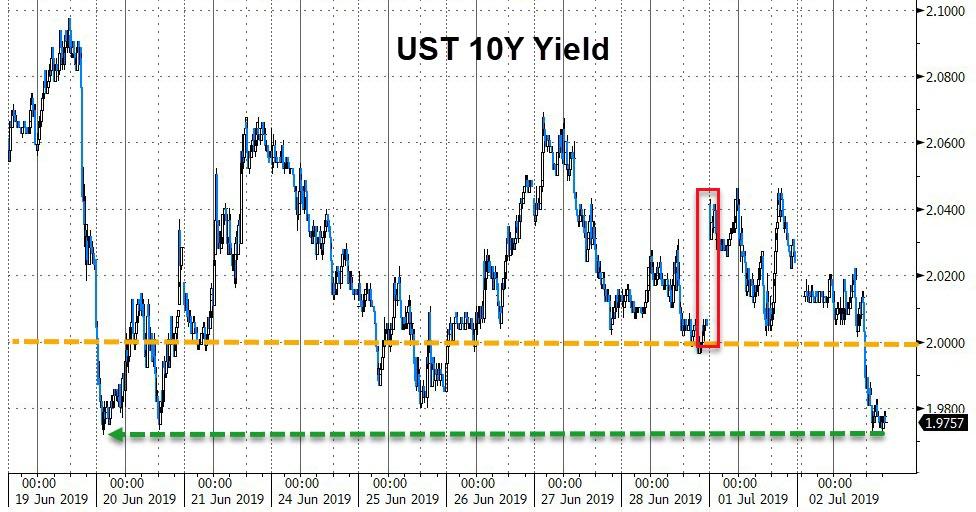
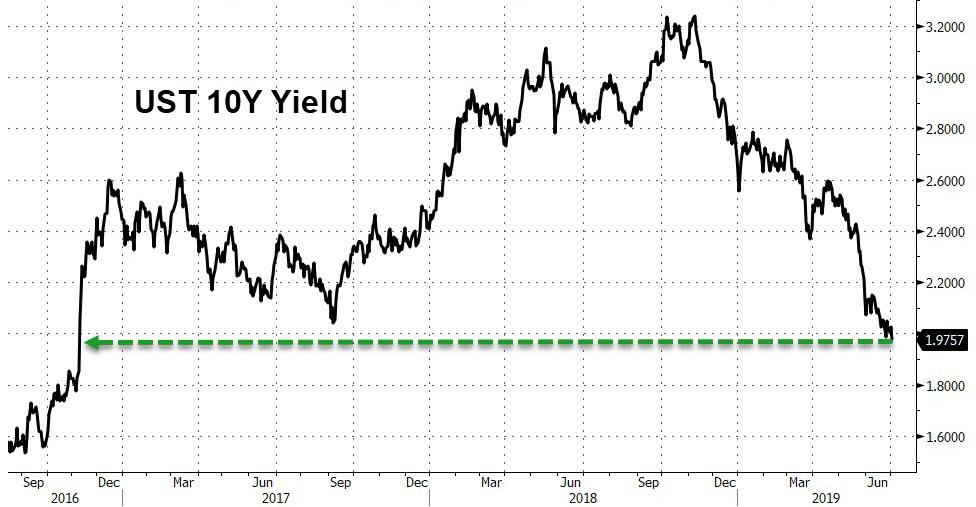
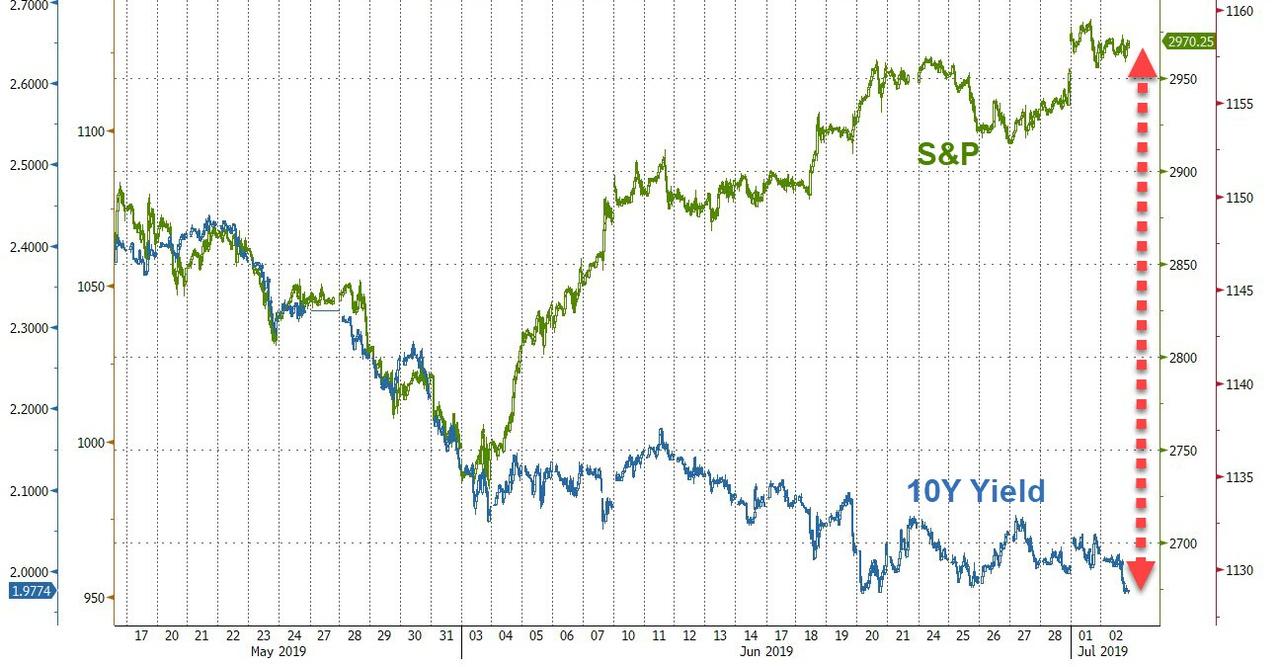
The 10-year bond yield tanked again and not only dropped below the 2% level but held there at 1.975%, which was its lowest close since November 2016. That gave a nice assist to SPLV, which gained +0.96% vs. SPY’s +0.26%.
With the S&P 500 pushing towards its 3k level, the markets still assume for the Fed to step up to the plate and lower rates this month. Expectations are 80% for 1/4% cut and 20% for a 0.5% cut. I find that hard to believe due to the elevated level of the indexes. Last year, the Fed lowered rates when equities were tanking and not when they were knocking on all-time highs.
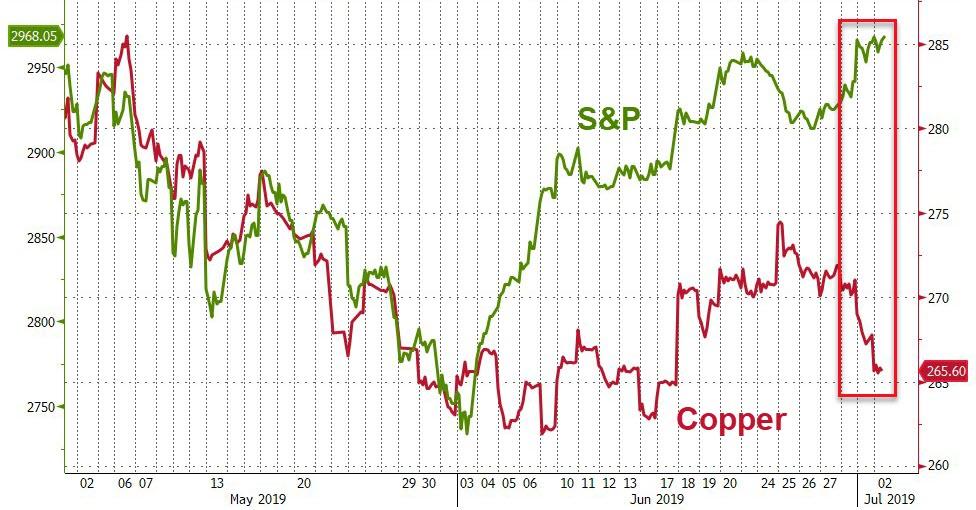
You may not know it, but the direction of Copper has indicated reliably in the past where the economy is going. This chart shows that we have a decoupling from equities. Just as the alligator jaws are widening further, bond yields are painting an entirely different picture from the route stocks are taking.
I can’t wait to see how this movie ends…
Read More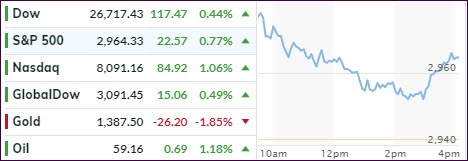