
- Moving the markets
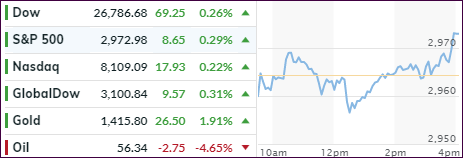
Moving around their respective unchanged lines was the motto of the day, as fading optimism from the trade ceasefire kept bullish momentum in check. However, in a repeat performance of yesterday, sudden buying pressure during the last hour prevented the major indexes from closing in the red, despite the short-squeeze having run out of ammo.
While trade negotiations have begun again, “this will take time, and we want to get it right,” said White House economic advisor Peter Navarro. In other words, there are no low hanging fruit to pick, and the markets will have to wait until positive news will provide a springboard for further equity advances.
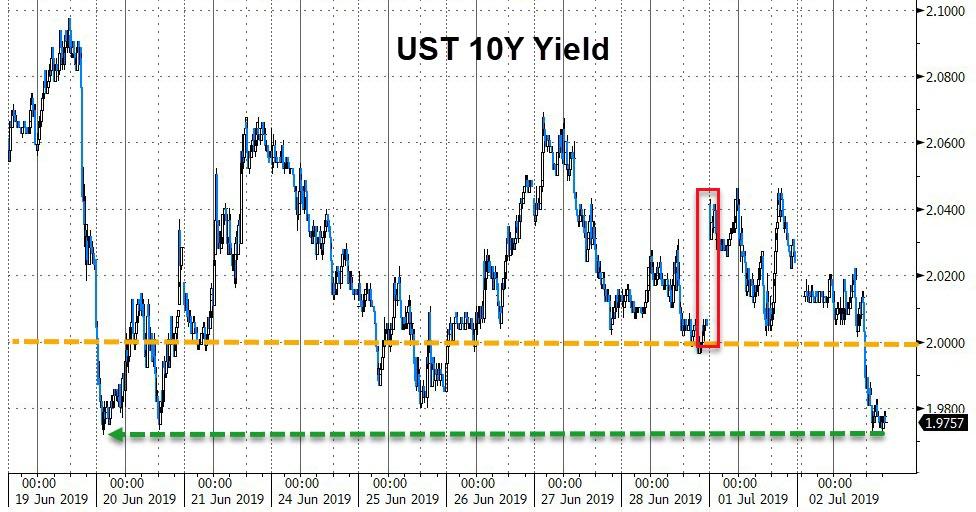
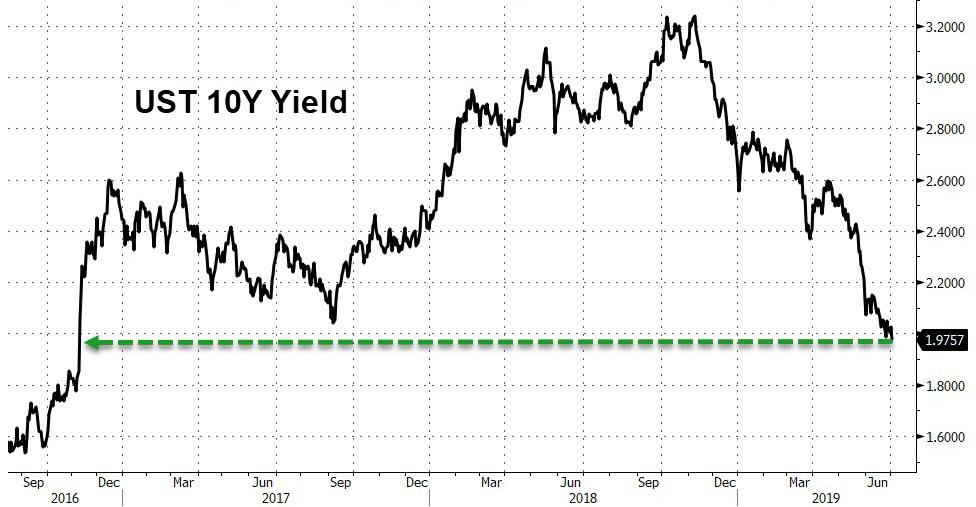
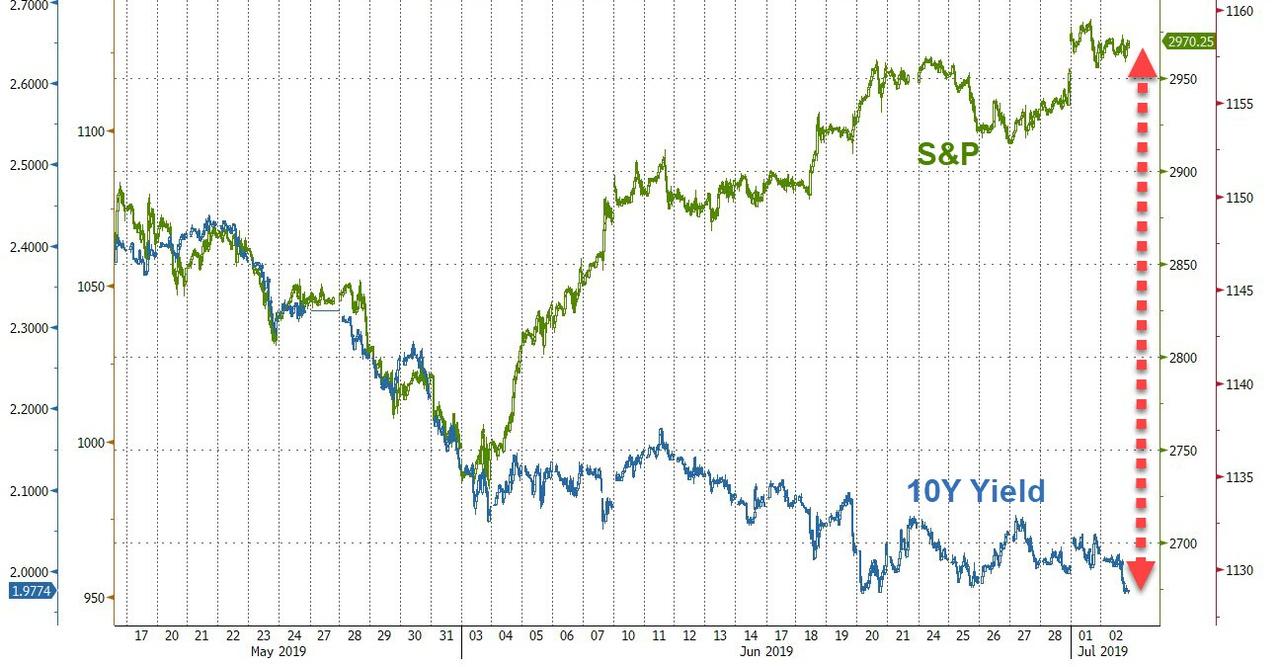
The 10-year bond yield tanked again and not only dropped below the 2% level but held there at 1.975%, which was its lowest close since November 2016. That gave a nice assist to SPLV, which gained +0.96% vs. SPY’s +0.26%.
With the S&P 500 pushing towards its 3k level, the markets still assume for the Fed to step up to the plate and lower rates this month. Expectations are 80% for 1/4% cut and 20% for a 0.5% cut. I find that hard to believe due to the elevated level of the indexes. Last year, the Fed lowered rates when equities were tanking and not when they were knocking on all-time highs.
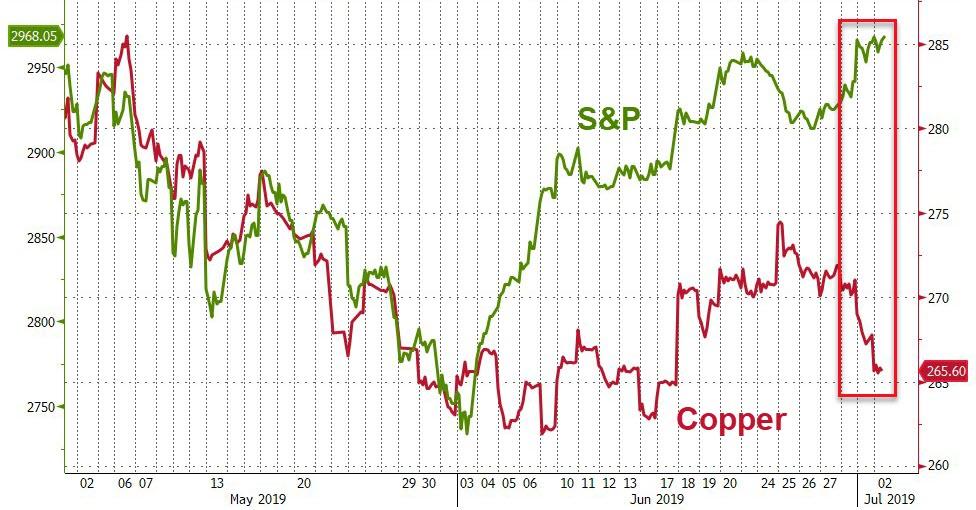
You may not know it, but the direction of Copper has indicated reliably in the past where the economy is going. This chart shows that we have a decoupling from equities. Just as the alligator jaws are widening further, bond yields are painting an entirely different picture from the route stocks are taking.
I can’t wait to see how this movie ends…
2. ETFs in the Spotlight
In case you missed the announcement and description of this section, you can read it here again.
It features 10 broadly diversified and sector ETFs from my HighVolume list as posted every Saturday. Furthermore, they are screened for the lowest MaxDD% number meaning they have been showing better resistance to temporary sell offs than all others over the past year.
The below table simply demonstrates the magnitude with which some of the ETFs are fluctuating regarding their positions above or below their respective individual trend lines (%+/-M/A). A break below, represented by a negative number, shows weakness, while a break above, represented by a positive percentage, shows strength.
For hundreds of ETF choices, be sure to reference Thursday’s StatSheet.
For this current domestic “Buy” cycle, here’s how some our candidates have fared:
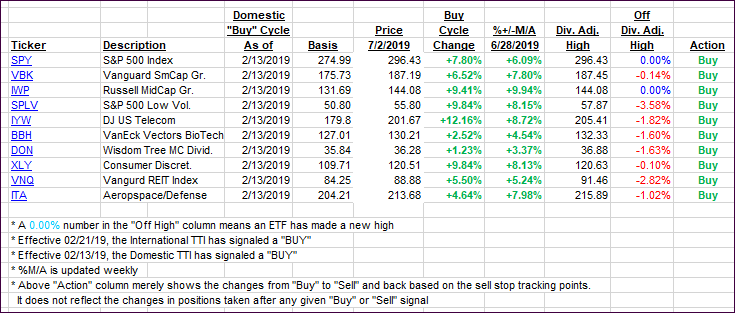
Again, the %+/-M/A column above shows the position of the various ETFs in relation to their respective long-term trend lines, while the trailing sell stops are being tracked in the “Off High” column. The “Action” column will signal a “Sell” once the -8% point has been taken out in the “Off High” column. For more volatile sector ETFs, the trigger point is -10%.
3. Trend Tracking Indexes (TTIs)
Our Trend Tracking Indexes (TTIs) were mixed with the Domestic one retreating a bit.
Here’s how we closed 07/02/2019:
Domestic TTI: +7.39% above its M/A (last close +7.51%)—Buy signal effective 02/13/2019
International TTI: +5.02 % above its M/A (last close +4.69%)—Buy signal effective 06/19/2019
Disclosure: I am obliged to inform you that I, as well as my advisory clients, own some of the ETFs listed in the above table. Furthermore, they do not represent a specific investment recommendation for you, they merely show which ETFs from the universe I track are falling within the specified guidelines.
Contact Ulli