
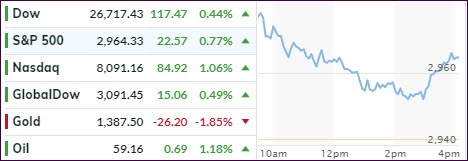
- Moving the markets
The much-awaited trade deal did not happen, but markets were relieved that the situation did not worsen. In fact, Trump and his counterpart Xi agreed to resume talks that had ended in May.
Both sides gave a little with Trump lifting some restrictions on telecom giant Huawei to conduct business with U.S. companies, and he will not impose additional tariffs. Xi agreed to buy more U.S. agricultural products with details forthcoming.
That was it! The markets took it as a positive at first, but cooler heads prevailed, and the early spike gave way to a session long slide until the last hour when buyers emerged to push the major indexes higher.
In the end, the trade truce did very little to indicate that a resolution to the conflict is imminent, which means traders will have to live with continuous uncertainty.
This also means that we may need another propellant to fuel further equity rallies, and I am not sure whether the current low bond yields, even if they are dropped further, can improve the current global growth outlook.
After all, we’ve seen a seemingly never-ending stretch of economic data disappointments now for several months, which should entice the Fed to please the markets again later in July. The question is “will another reduction in rates have the desired effect of pumping up the domestic economy—or the markets?”
2. ETFs in the Spotlight
In case you missed the announcement and description of this section, you can read it here again.
It features 10 broadly diversified and sector ETFs from my HighVolume list as posted every Saturday. Furthermore, they are screened for the lowest MaxDD% number meaning they have been showing better resistance to temporary sell offs than all others over the past year.
The below table simply demonstrates the magnitude with which some of the ETFs are fluctuating regarding their positions above or below their respective individual trend lines (%+/-M/A). A break below, represented by a negative number, shows weakness, while a break above, represented by a positive percentage, shows strength.
For hundreds of ETF choices, be sure to reference Thursday’s StatSheet.
For this current domestic “Buy” cycle, here’s how some our candidates have fared:
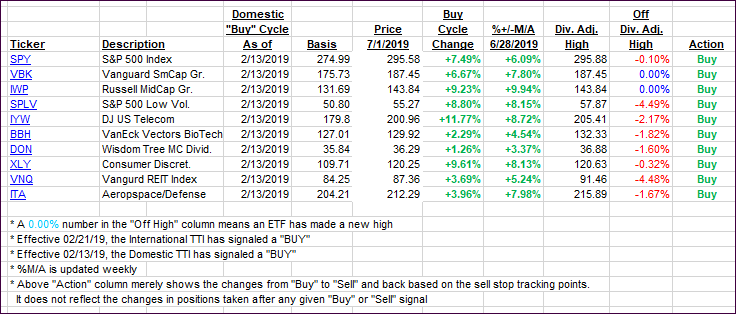
Again, the %+/-M/A column above shows the position of the various ETFs in relation to their respective long-term trend lines, while the trailing sell stops are being tracked in the “Off High” column. The “Action” column will signal a “Sell” once the -8% point has been taken out in the “Off High” column. For more volatile sector ETFs, the trigger point is -10%.
3. Trend Tracking Indexes (TTIs)
Our Trend Tracking Indexes (TTIs) headed higher as the bulls saw the trade truce as a positive.
Here’s how we closed 07/01/2019:
Domestic TTI: +7.51% above its M/A (last close +6.74%)—Buy signal effective 02/13/2019
International TTI: +4.69% above its M/A (last close +4.12%)—Buy signal effective 06/19/2019
Disclosure: I am obliged to inform you that I, as well as my advisory clients, own some of the ETFs listed in the above table. Furthermore, they do not represent a specific investment recommendation for you, they merely show which ETFs from the universe I track are falling within the specified guidelines.
Contact Ulli