Weekly StatSheet For The ETF Tracker Newsletter – Updated Through 02/06/2020

Ulli ETF StatSheet Contact

ETF Data updated through Thursday, February 6, 2020
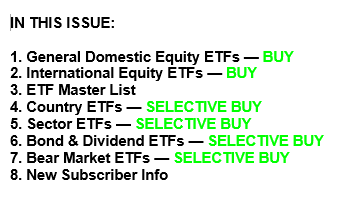
Methodology/Use of this StatSheet:

1. From the universe of over 1,800 ETFs, I have selected only those with a trading volume of over $5 million per day (HV ETFs), so that liquidity and a small bid/ask spread are assured.

2. Trend Tracking Indexes (TTIs)

Buy or Sell decisions for Domestic and International ETFs (section 1 and 2), are made based on the respective TTI and its position either above or below its long-term M/A (Moving Average). A crossing of the trend line from below accompanied by some staying power above constitutes a “Buy” signal. Conversely, a clear break below the line constitutes a “Sell” signal. Additionally, I use a 7.5% trailing stop loss on all positions in these categories to control downside risk.

3. All other investment arenas do not have a TTI and should be traded based on  the position of the individual ETF relative to its own respective trend line (%M/A). That’s why those signals are referred to as a “Selective Buy.” In other words, if an ETF crosses its own trendline to the upside, a “Buy” signal is generated. Since these areas tend to be more volatile, I recommend a wider trailing sell stop of 7.5% -10% depending on your risk tolerance.

If you are unfamiliar with some of the terminology, please see Glossary of Terms and new subscriber information in section 9.     

1. DOMESTIC EQUITY ETFs: BUY — since 02/13/2019

Click on chart to enlarge

Our main directional indicator, the Domestic Trend Tracking Index (TTI-green line in the above chart) is now positioned above its long-term trend line (red) by +8.22% after having generated a new Domestic “Buy” signal effective 2/13/19 as posted.

Read More
No Market Commentary

Ulli Uncategorized Contact

I got delayed with some business commitments and will not be able to write today’s market commentary.

Regular posting will resume tomorrow.

Ulli…

The Bullish Beat Goes On

Ulli Market Commentary Contact

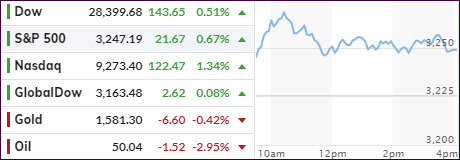
[Chart courtesy of MarketWatch.com]

  1. Moving the markets

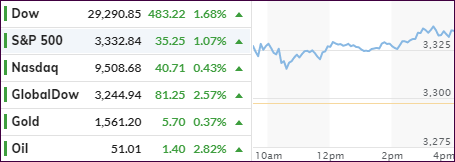
At least for the moment, it seems that nothing can disrupt this running bull market, even though, the cause of last week’s rut, namely the coronavirus, is far from being contained.

Sentiment, that stepped-up containment efforts, along with work towards new vaccines, may mitigate any negative economic impacts, was the bullish driver that sent the Dow to its second +400-point session in a row.

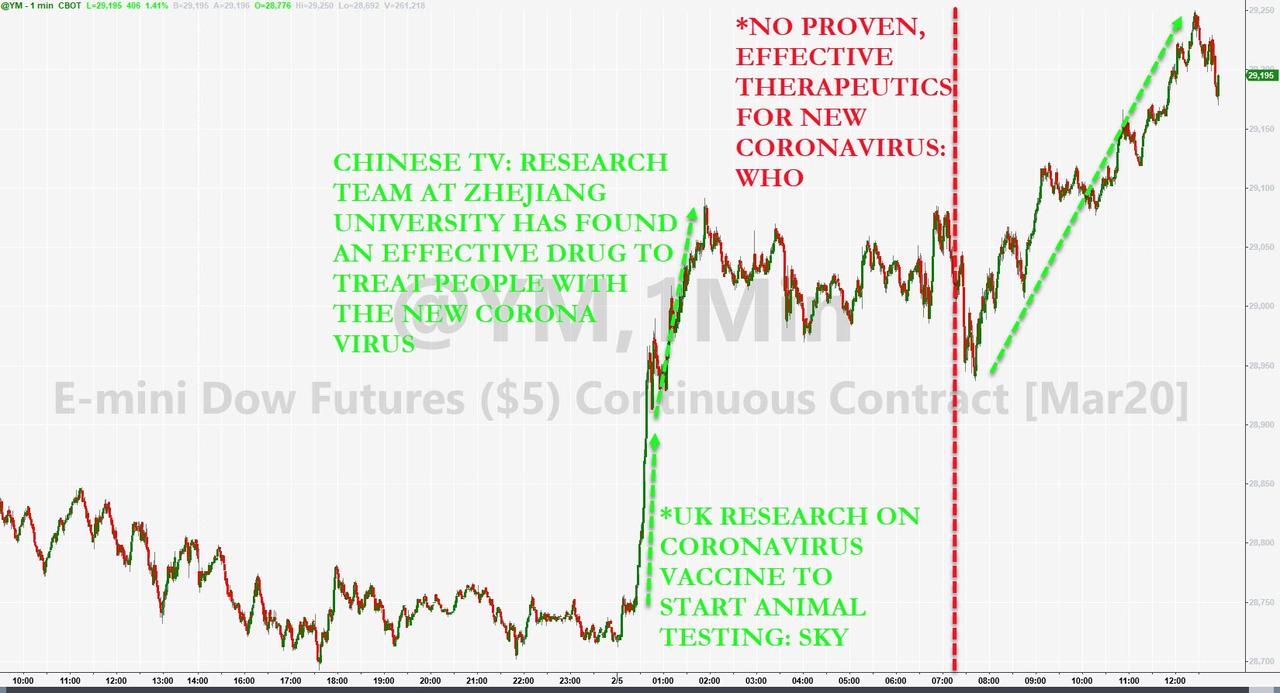
Hope emerged that new treatments, such as a newly developed cocktail of drugs by a Chinese university, will soon be deployed to fight the deadly virus. UK researchers also reported having made progress in lab tests towards a vaccine.  

Offsetting that good news was the WHO by saying that “there are no known effective therapeutics against the coronavirus,” but that they will convene one hundred experts next week to create a plan for developing effective treatments.

Be that as it may, the markets did not care, and rumors about potential progress was all it took to keep the bullish dream alive during the entire session.

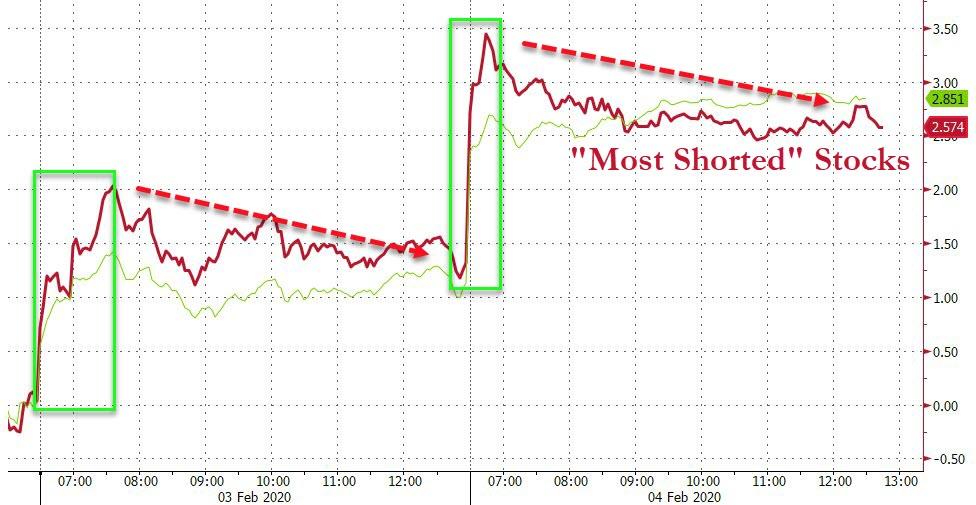
Of course, none of this could have happened without the assistance of the daily short squeeze, which again was the driver, as it has been for the past 3 trading days. ZH reported that the magnitude of this 3-day squeeze has been the biggest since the September melt-up.

I hope you are enjoying the ride.

Read More

Euphoria Is Back

Ulli Market Commentary Contact

[Chart courtesy of MarketWatch.com]

  1. Moving the markets

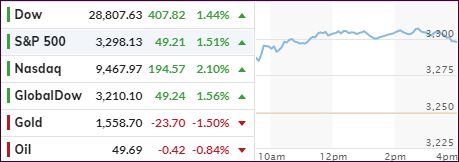
The stimulus effort by the People’s Bank of China to combat the economic impact of the coronavirus set a positive tone for world markets early on, with the domestic ones opening sharply higher aided by another short squeeze. It was simply a matter of investors gaining confidence in that central bankers will take measures to stabilize economies, which in turn supports a move back into risk assets again.

Politics supported equities today as Trump is expected to be cleared of impeachment charges on Wednesday, while the State of the Union address tonight is anticipated to be one of positives, thereby further supporting bullish sentiment.

Despite the coronavirus being far from contained, traders have simply reacted in an upbeat manner based on nothing more than efforts by the Chinese to limit the spread and the injection of funds to stem any economic fallout.

I think this debacle is far from being over, but right now, we are enjoying the rebound.

Read More

Optimism Reigns

Ulli Market Commentary Contact

[Chart courtesy of MarketWatch.com]

  1. Moving the markets

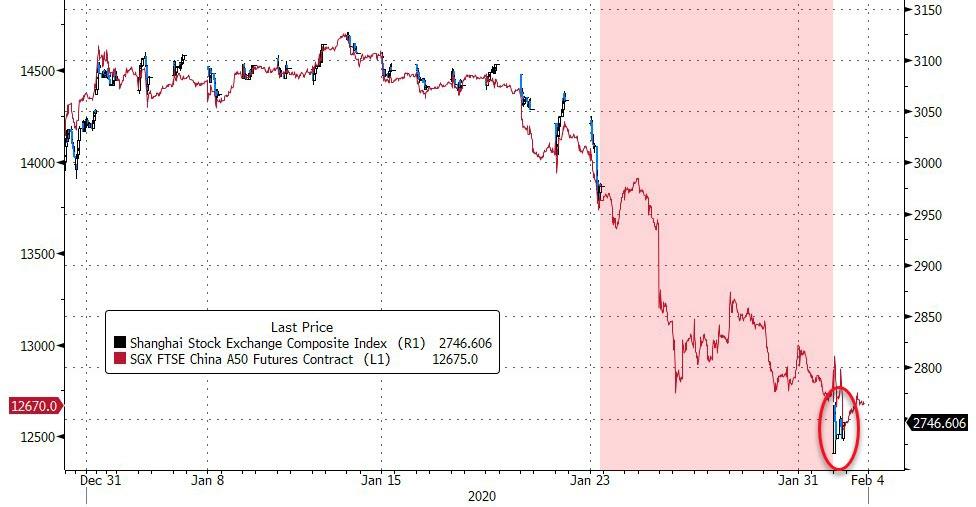
After Friday’s drubbing, and in view of China’s stock market getting clobbered at the tune of some -8%, domestic equities jumped right after the opening bell. While the latter part of the session was flat, the major indexes made up some lost ground in part thanks to optimism that the coronavirus will be contained.

Helping the recovery were encouraging data from the manufacturing sector, whose PMI index rose to a six-month high of 50.9% in January against expectations of 48.5%. That is significant in that any reading below 50% indicates contraction while any reading above it shows expansion.

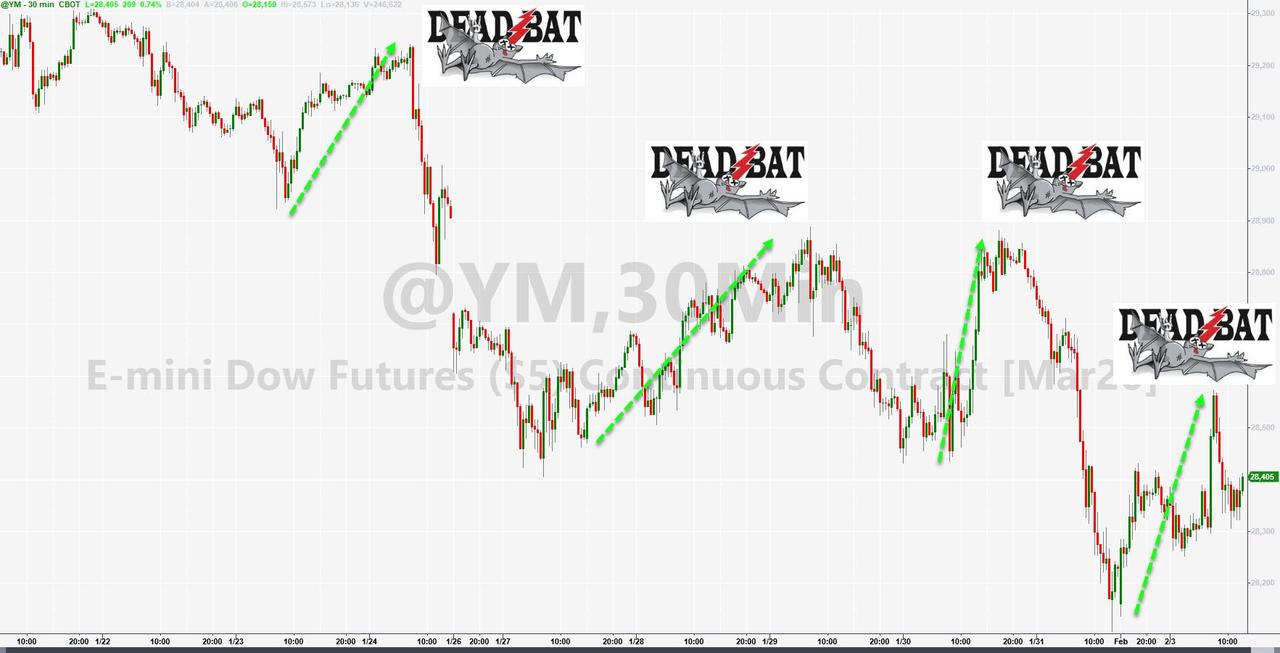
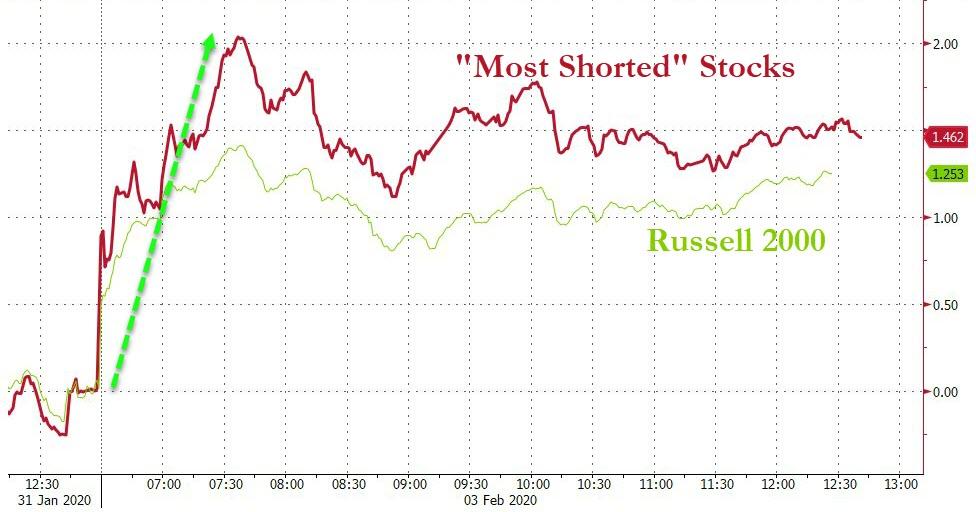
Nevertheless, the entire rebound was about nothing, causing ZH to describe today’s action as simply another “dead-bat-bounce,” as this chart demonstrates. However, an early short squeeze helped to get the bullish momentum going.

Concerns continue to linger about the Chinese stock market, which not only dropped precipitously but did so despite a ban on short selling. Trading was halted for hundreds of companies, after their prices dropped 10%, which triggered the mandatory hold. It appears that there is more fallout to come.

All that upheaval happened despite the POBC (Peoples Bank of China) announcing a $174 billion injection into their economic system to stem the downturn. That is to be followed by other stabilization measures.

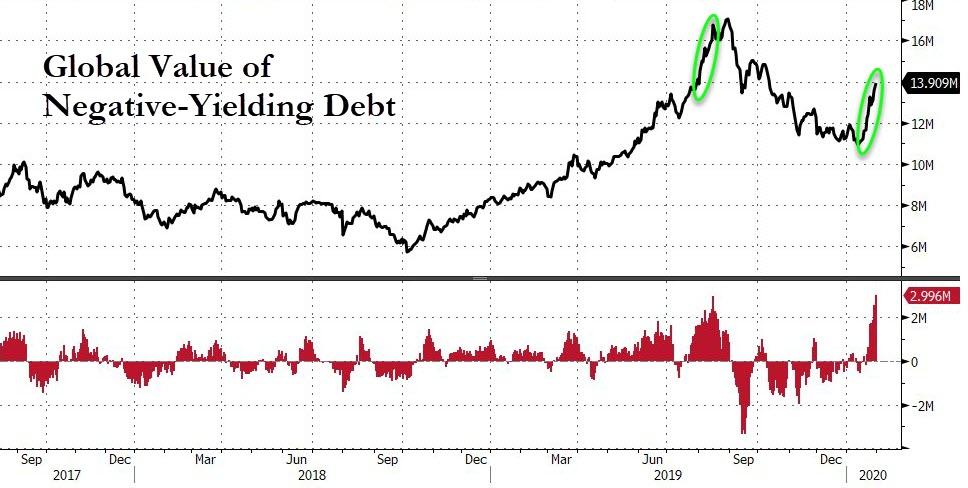
Worldwide, negative yielding debt shot up by another $3 trillion in the last 12 days, according to this chart by Bloomberg. I think it’s just a matter of time until U.S. treasuries follow that trend.

Read More

ETFs On The Cutline – Updated Through 01/31/2020

Ulli ETFs on the Cutline Contact

Below, please find the latest High-Volume ETF Cutline report, which shows how far above or below their respective long-term trend lines (39-week SMA) my currently tracked ETFs are positioned.

This report covers the HV ETF Master List from Thursday’s StatSheet and includes 322 High Volume ETFs, defined as those with an average daily volume of more than $5 million, of which currently 248 (last week 279) are hovering in bullish territory. The yellow line separates those ETFs that are positioned above their trend line (%M/A) from those that have dropped below it.

Take a look:                                                                   

The HV ETF Master Cutline Report

In case you are not familiar with some of the terminology used in the reports, please read the Glossary of Terms. If you missed the original post about the Cutline approach, you can read it here.