
- Moving the markets
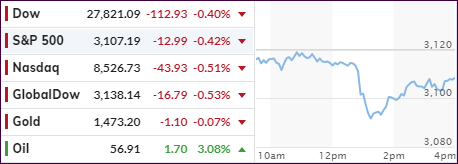
The markets started the session by meandering slightly below their respective unchanged lines when a sudden dive took the starch out of any existing support. As I posted yesterday, a new headline about how close the latest trade deal might be was sure to be on deck.
Well, we got trade headlines, but they revealed exactly the opposite of what was expected, namely that phase one of this much jawboned about event may not be completed this year. To stoke the fire of discontent even more, China condemned a US Senate resolution supporting human rights in Hong Kong.
Then it was the US’s turn to emphasize that “rolling back tariffs for a deal that fails to address core intellectual property and technology transfer issues will not be seen as good deal for the US.” That was the final nail in the coffin to seal the downward trend of equities.
But the mocking continued, as the editor of China’s Global Times, after his earlier threat that “China wants a deal but is prepared for the worst-case scenario, a prolonged trade war,” proceeded to taunt the US farmers with “wait for a trade deal before getting bigger tractors.” You just can’t make this up, and it makes me wonder how long this soap opera will go on.
Despite all this negativity, a late day rebound lifted the indexes off their lows but fell short of moving them into the green. Nevertheless, the markets are showing tremendous resilience, especially when you consider that the Dow has been down 2 days in a row for its biggest drop in 6 weeks, and this very drop amounted to less than 1%.
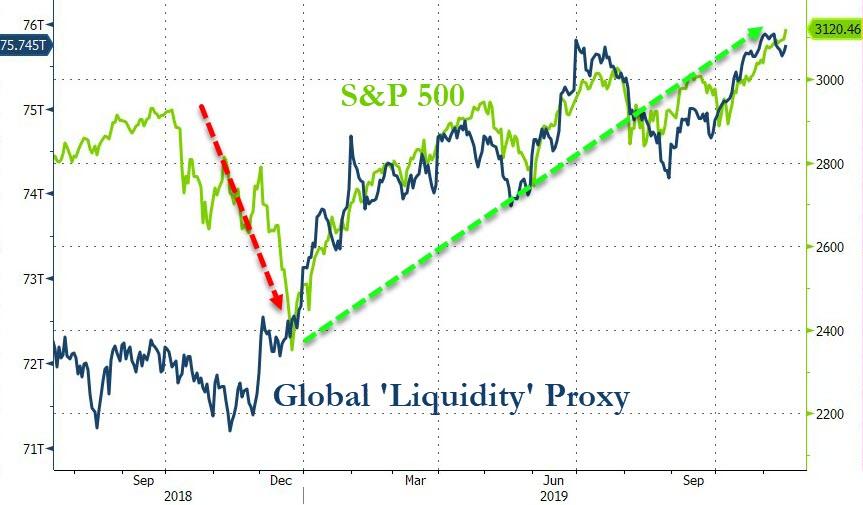
The S&P 500 has not had 1% correction in 28 days and, as ZH points out, it went 36 days in June/July without one. Of course, as I have pointed out on many occasion, the main driver that controls market direction is global liquidity, which this chart (Source: Bloomberg) clearly demonstrates.
2. ETFs in the Spotlight
In case you missed the announcement and description of this section, you can read it here again.
It features 10 broadly diversified and sector ETFs from my HighVolume list as posted every Saturday. Furthermore, they are screened for the lowest MaxDD% number meaning they have been showing better resistance to temporary sell offs than all others over the past year.
The below table simply demonstrates the magnitude with which some of the ETFs are fluctuating regarding their positions above or below their respective individual trend lines (%+/-M/A). A break below, represented by a negative number, shows weakness, while a break above, represented by a positive percentage, shows strength.
For hundreds of ETF choices, be sure to reference Thursday’s StatSheet.
For this current domestic “Buy” cycle, here’s how some our candidates have fared:
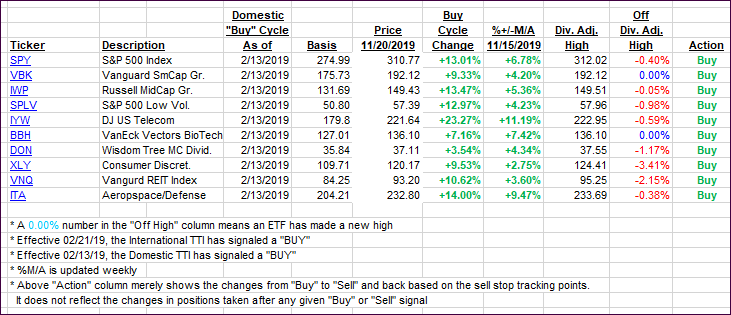
Again, the %+/-M/A column above shows the position of the various ETFs in relation to their respective long-term trend lines, while the trailing sell stops are being tracked in the “Off High” column. The “Action” column will signal a “Sell” once the -8% point has been taken out in the “Off High” column. For more volatile sector ETFs, the trigger point is -10%.
3. Trend Tracking Indexes (TTIs)
Our Trend Tracking Indexes (TTIs) headed south with a late rebound cutting down on early losses.
Here’s how we closed 11/20/2019:
Domestic TTI: +5.48% above its M/A (prior close +5.88%)—Buy signal effective 02/13/2019
International TTI: +3.51% above its M/A (prior close +3.96%)—Buy signal effective 10/29/2019
Disclosure: I am obliged to inform you that I, as well as my advisory clients, own some of the ETFs listed in the above table. Furthermore, they do not represent a specific investment recommendation for you, they merely show which ETFs from the universe I track are falling within the specified guidelines.
Contact Ulli