
ETF Tracker StatSheet
You can view the latest version here.
DRIVING THE MARKETS: TRADE HOPE AND RETAIL HEADLINE
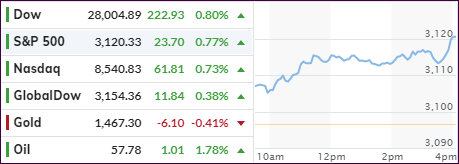
[Chart courtesy of MarketWatch.com]
- Moving the markets
While today’s headline retail number showed a rise of +0.3% MoM, which was better than the expected +0.2%, the under the hood core number looked mixed at best by only rising +0.1% MoM vs. an expected +0.3%. But headline news are what computer algos read, so up we went.
The
initial boost came from alleged positive US-China trade war developments,
with the White House econ advisor Kudlow saying Thursday night that “negotiators
are getting close to an agreement,” however, Trump added that “he likes
what he sees, he’s not ready to make a commitment, we have no agreement just
yet.”
In other words, there is no deal, only promises and possibilities, but that’s all it takes these days to keep traders and algos happy, a condition which pushed the major indexes into new all-time territory.
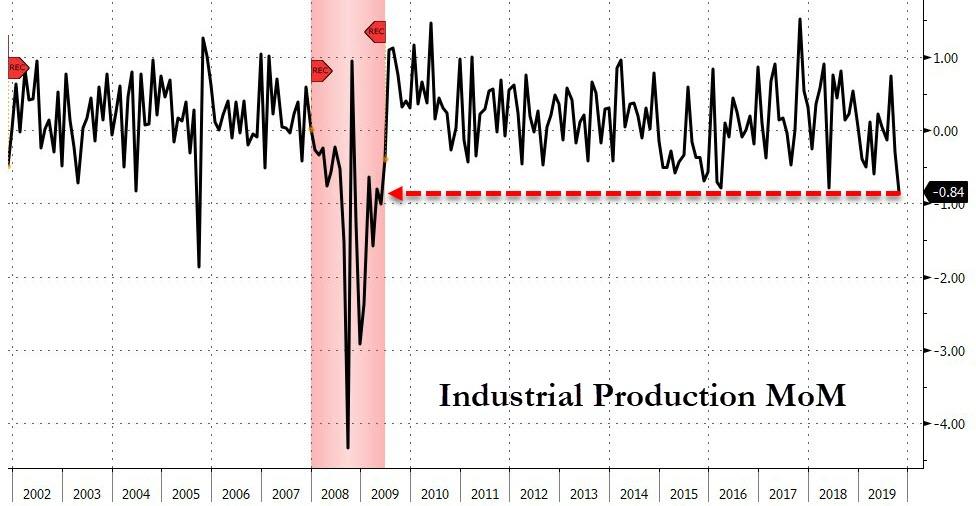
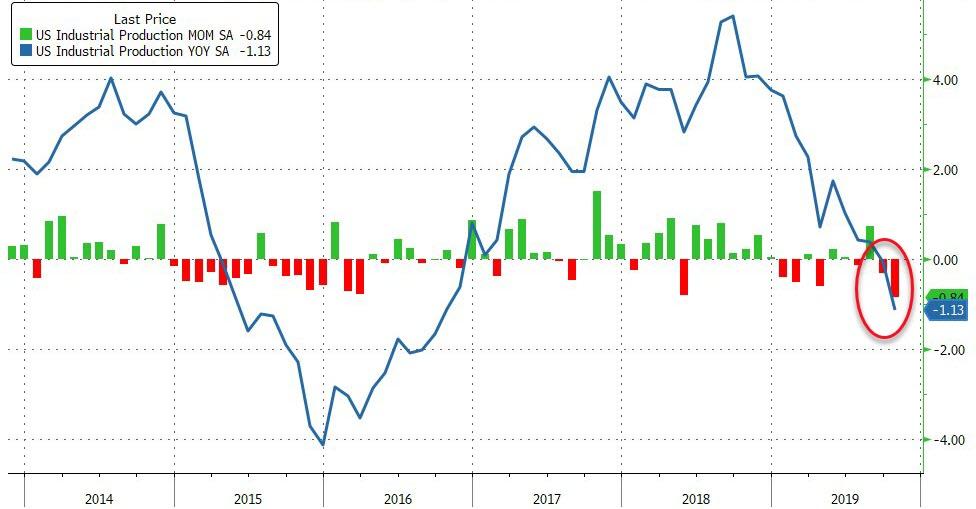
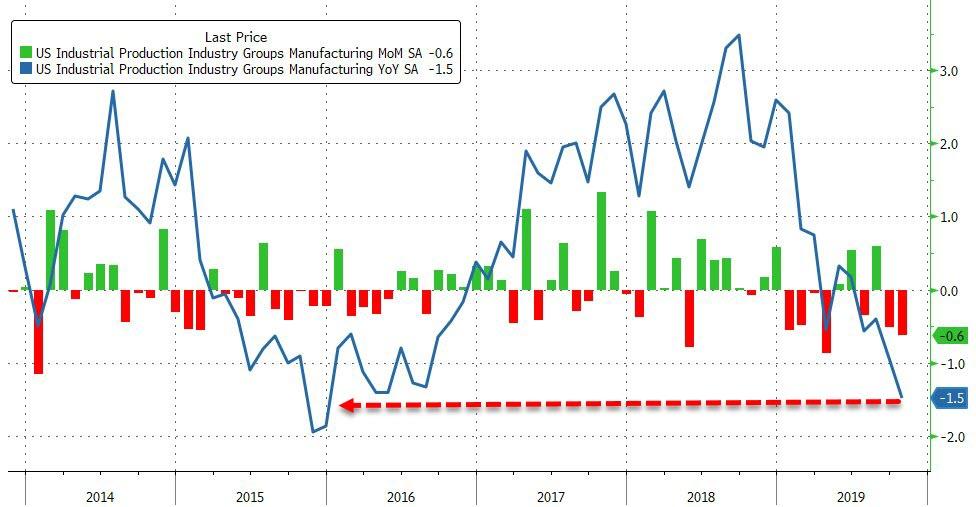
Even poor economic news good not stem the march higher. US MoM Industrial Production plunged the most since March 2009, as October’s -0.8% collapse led to a YoY decline of -1.13%. In addition, Manufacturing output fell -0.6%, its weakest reading since December 2015 (Source: ZeroHedge).
I am merely pointing this out to clarify that the stock market and the underlying economy are in no way connected, and that a high level of stock prices does not indicate a solid economic environment.
This is further confirmed by the fact that the GDP for Q4 2019 has crashed with the US economy growing at its slowest pace in 4 years, as the Fed’s tracking estimates having tumbled by over 0.4% just the past week. The US GDP in Q4 2019 is now set to print at around 0.35%, which is anemic and in no way justifies the current level of stock indexes.
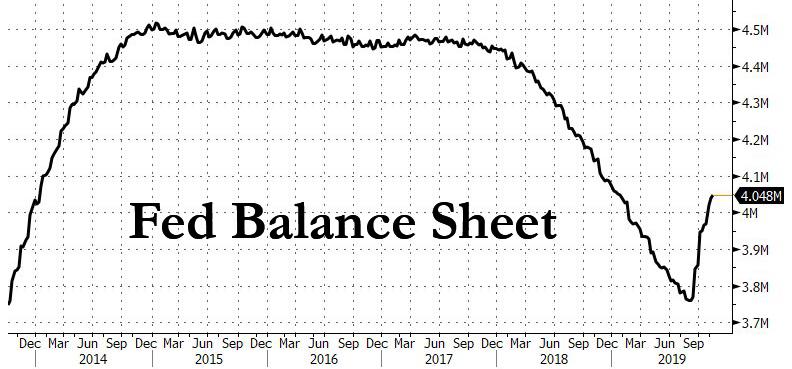
But that is not what matters. What is critically important for the continuation of the bullish ramp, as I pointed out before, is the liquidity in the market, which has been created by an increase in the Fed’s balance sheet. It grew by some $280 billion in the past two months alone and is directly responsible for driving equities relentlessly higher.
2. ETFs in the Spotlight
In case you missed the announcement and description of this section, you can read it here again.
It features 10 broadly diversified and sector ETFs from my HighVolume list as posted every Saturday. Furthermore, they are screened for the lowest MaxDD% number meaning they have been showing better resistance to temporary sell offs than all others over the past year.
The below table simply demonstrates the magnitude with which some of the ETFs are fluctuating regarding their positions above or below their respective individual trend lines (%+/-M/A). A break below, represented by a negative number, shows weakness, while a break above, represented by a positive percentage, shows strength.
For hundreds of ETF choices, be sure to reference Thursday’s StatSheet.
For this current domestic “Buy” cycle, here’s how some our candidates have fared:
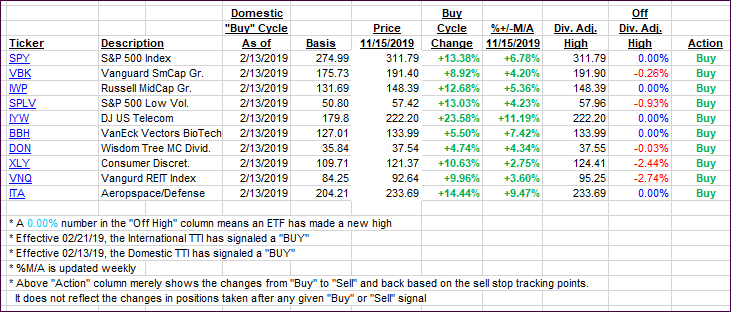
Again, the %+/-M/A column above shows the position of the various ETFs in relation to their respective long-term trend lines, while the trailing sell stops are being tracked in the “Off High” column. The “Action” column will signal a “Sell” once the -8% point has been taken out in the “Off High” column. For more volatile sector ETFs, the trigger point is -10%.
3. Trend Tracking Indexes (TTIs)
Our Trend Tracking Indexes (TTIs) jumped as the bullish mood continued despite poor economic news.
Here’s how we closed 11/15/2019:
Domestic TTI: +6.10% above its M/A (prior close +5.58%)—Buy signal effective 02/13/2019
International TTI: +4.05% above its M/A (prior close +3.53%)—Buy signal effective 10/29/2019
Disclosure: I am obliged to inform you that I, as well as my advisory clients, own some of the ETFs listed in the above table. Furthermore, they do not represent a specific investment recommendation for you, they merely show which ETFs from the universe I track are falling within the specified guidelines.
———————————————————-
WOULD YOU LIKE TO HAVE YOUR INVESTMENTS PROFESSIONALLY MANAGED?
Do you have the time to follow our investment plans yourself? If you are a busy professional who would like to have his portfolio managed using our methodology, please contact me directly or get more details here.
———————————————————
Back issues of the ETF Tracker are available on the web.
Contact Ulli