Weekly StatSheet For The ETF Tracker Newsletter – Updated Through 12/05/2019

Ulli ETF StatSheet Contact

ETF Data updated through Thursday, December 5, 2019

Methodology/Use of this StatSheet:

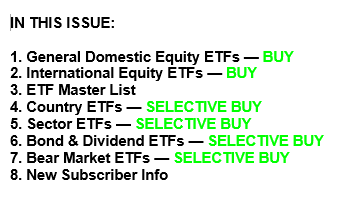
1. From the universe of over 1,800 ETFs, I have selected only those with a trading volume of over $5 million per day (HV ETFs), so that liquidity and a small bid/ask spread are assured.

2. Trend Tracking Indexes (TTIs)

Buy or Sell decisions for Domestic and International ETFs (section 1 and 2), are made based on the respective TTI and its position either above or below its long-term M/A (Moving Average). A crossing of the trend line from below accompanied by some staying power above constitutes a “Buy” signal. Conversely, a clear break below the line constitutes a “Sell” signal. Additionally, I use a 7.5% trailing stop loss on all positions in these categories to control downside risk.

3. All other investment arenas do not have a TTI and should be traded based on  the position of the individual ETF relative to its own respective trend line (%M/A). That’s why those signals are referred to as a “Selective Buy.” In other words, if an ETF crosses its own trendline to the upside, a “Buy” signal is generated. Since these areas tend to be more volatile, I recommend a wider trailing sell stop of 7.5% -10% depending on your risk tolerance.

If you are unfamiliar with some of the terminology, please see Glossary of Terms and new subscriber information in section 9.     

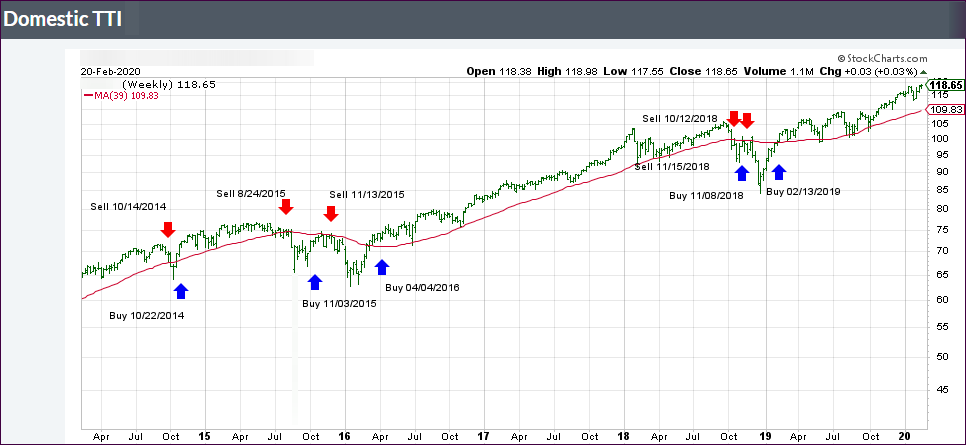
1. DOMESTIC EQUITY ETFs: BUY — since 02/13/2019

Click on chart to enlarge

Our main directional indicator, the Domestic Trend Tracking Index (TTI-green line in the above chart) is now positioned above its long-term trend line (red) by +5.35% after having generated a new Domestic “Buy” signal effective 2/13/19 as posted.

Read More

Shrugging Off Trade Dispute Concerns

Ulli Market Commentary Contact

[Chart courtesy of MarketWatch.com]
  1. Moving the markets

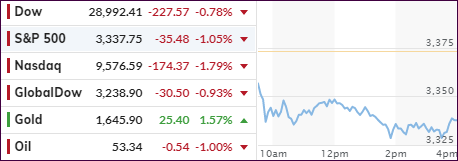
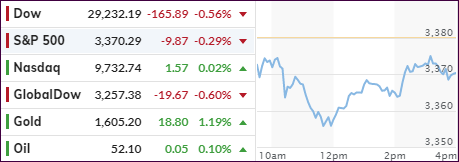
An early morning pop gave way to a drop, which gave way to a slow but steady recovery with the major indexes managing to reclaim their respective unchanged lines by a small margin.

What caused the comeback? Nothing noteworthy, other than a China trade spokesperson uttering the words that computer algos thrive on, namely that the so-called phase 1 negotiations designed to cease tariff hostilities, are “progressing.”

But the spokesman emphasized China’s desire to make existing tariff rollbacks a part of any resolution, which may not sit well with the White House. As a result, the tug-of-war to save face is bound to continue.

On deck tomorrow will be the always eagerly anticipated jobs report with the consensus forecast calling for a gain of 180k new jobs. Anything close to that number will likely give the markets a boost, unless bad trade news provides the bears with something to cheer about.

Read More

Recovering Lost Ground

Ulli Market Commentary Contact

[Chart courtesy of MarketWatch.com]
  1. Moving the markets

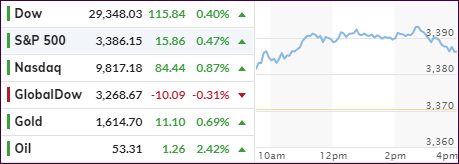
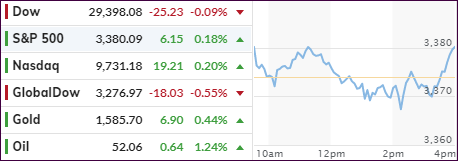
Today was reversal day, as the trade soap opera story was changed again based on an unsourced rumor that a phase-1 deal was still in the works. Even though nothing of substance was offered, it was enough hope for the computer algos to shift in reverse and pull the markets out of the doldrums.

One analyst summed up the trade story like this:

President Trump stated he is in no rush and “in some ways I think it’s better to wait until after the election” to make a trade deal with China. Not September, as we were told by those ‘in the know’ at certain financial media; not October, as were again told; not November, as we were still told; and not December, and perhaps not early 2020 – but after the US presidential election….which might as well be forever for markets.

Especially as Trump will not have any electoral concerns at that point so might just dump the whole idea and go ‘all-in’. Indeed, Commerce Secretary Ross also made clear if “substantial progress” isn’t seen soon then the final 15% tariff tranche is indeed going to happen on 15 December.

And so, the saga goes on. The major indexes popped nicely but gave back some of their early gains, as momentum faded into the close. The market-implied odds of a trade deal rebounded and are now at about 50/50, which is more or less a coin-flip, while they were at 70% just in early November, according to ZH.

Helping today’s rebound was a double whammy short squeeze, while the decoupling of stocks and bonds, which I posted yesterday, continued despite stocks almost touching the 10-year bond yield, which gained 5.3 basis points  to end the day at 1.772%.

Since the Fed has made its policy of lower interest rates clear, the stock indexes are now dependent on the latest rumors from the trade front. And I am sure, they will continue to be full of surprises.

Read More

Torpedoing The Markets: Stocks And Bond Yields Tumble

Ulli Market Commentary Contact

[Chart courtesy of MarketWatch.com]
  1. Moving the markets

As I pondered yesterday, the While House indeed fired the next salvo about the trade talks, but it was not what the markets expected. Stocks got hit hard when Trump announced that the idea of holding off on a US-China trade deal until after the 2020 election was appealing.

This undermined confidence and hope, by traders and computer algos alike, that a deal may be completed before new import tariffs are scheduled to be imposed by December 15.

At the same time, the US threatened 100% tariffs on some $2.4 billion in French goods over their digital tax, which has adversely affected US tech companies. Additionally, potential tariffs on countries like Brazil and Argentina were on the menu as well.

That seemed to conclude or end, at least for the time being, the game of endless headlines spouting the “a trade deal is close” theme designed to pump the markets to ever new highs.

Especially the past two days have seen a sudden and dramatic reversal in sentiment, as a result of less-than-positive trade deal comments. The market implied odds of a trade deal have now plunged.

One of Nomura’s analysts summed it up this way:

What forced self-reinforcing buying pressure on the way up is about to feed a vicious cycle of selling on the way down.”

That simply means some of the big players are chomping at the bit to short the markets, but only once a certain level has been hit. So, great news, such as the good old standby “a trade deal is close,” are sorely needed, in order to stem current downside momentum.

The 10-year bond yield collapsed 10.6 basis points to end at 1.72%. That’s a huge move, and it finally showed the discrepancy between bond yields and the Dow narrowing dramatically, as ZH pointed out with this chart. The S&P 500 had its worst start to a December since 2008. A tip of the hat goes to Bloomberg for this graph.

While we witnessed a slow crawl back from the day’s lows, it was not nearly enough to get back to even, as the possibility of a postponed trade deal was simply too much of a negative to overcome.

Read More

One-Two Punch Spooks Markets

Ulli Market Commentary Contact

[Chart courtesy of MarketWatch.com]
  1. Moving the markets

Just as I posted the amazing fact last Wednesday that the S&P 500 had not corrected more than -0.5% in 35 days, it happened suddenly with the index shedding a moderate -0.86%.

The markets got hit right at the opening with a one-two punch in form of a worse-than-expected manufacturing report and mixed comments on the latest involving the US-China trade tensions.

The ISM manufacturing index dropped to 48.1% from 48.3% in October against expectations of an overly optimistic 49.2%. Readings below 50% indicate that business conditions are getting worse.

AS ZH reports, a quadruple whammy of not-awesome trade related comments gave an assist to the bears:

  • 0602ET *TRUMP TO RESTORE TARIFF ON STEEL SHIPPED FROM BRAZIL, ARGENTINA
  • 1035ET *TRUMP WILL INCREASE TARIFFS IF NO CHINA DEAL, ROSS TELLS FOX
  • 1200ET *TRUMP AIDE SAYS IT’S UP TO CHINA IF DEAL WILL BE MADE THIS YR
  • 1230ET *CHINA TO RELEASE ‘UNRELIABLE ENTITY LIST’: GLOBAL TIMES

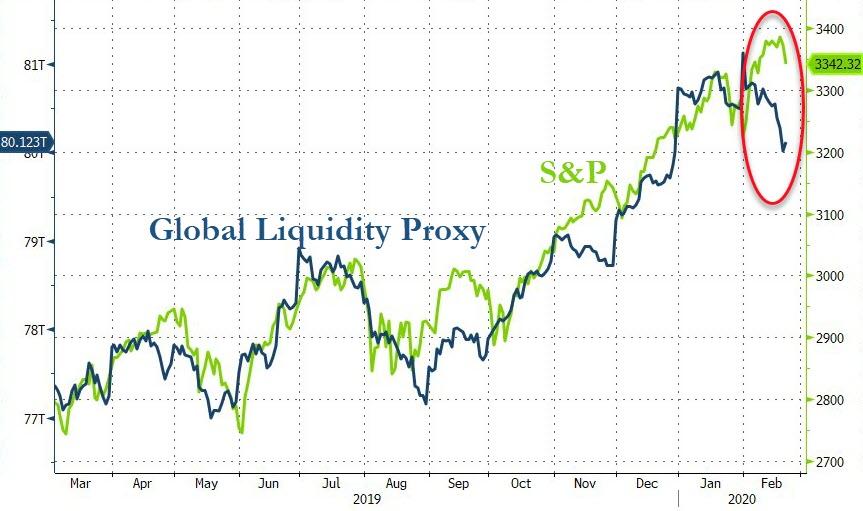
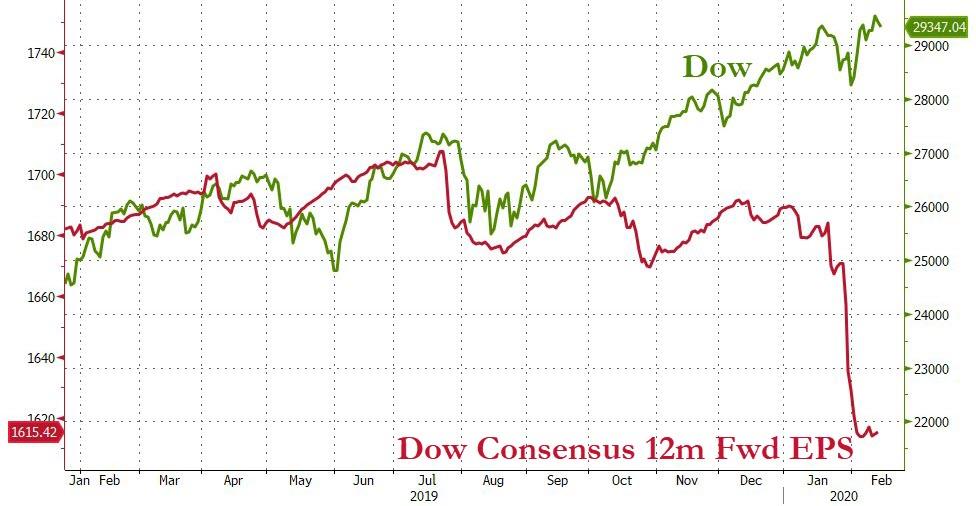
As a result, domestic equities were spanked and suffered their biggest drop in 6 weeks. As I commented on many occasions, not only does the global economy look murky at best, the US is not much better, as this chart shows.

On the other hand, the pullback was mild compared to the recent gains, and the bulls may have more to smile about, once the White House fires the next verbal salvo about how well phase 1 and 2 of the trade deal are progressing. Wait for it…

Read More

Weekly StatSheet For The ETF Tracker Newsletter – Updated Through 11/27/2019

Ulli ETF StatSheet Contact

ETF Data updated through Wednesday, November 27, 2019

Methodology/Use of this StatSheet:

1. From the universe of over 1,800 ETFs, I have selected only those with a trading volume of over $5 million per day (HV ETFs), so that liquidity and a small bid/ask spread are assured.

2. Trend Tracking Indexes (TTIs)

Buy or Sell decisions for Domestic and International ETFs (section 1 and 2), are made based on the respective TTI and its position either above or below its long-term M/A (Moving Average). A crossing of the trend line from below accompanied by some staying power above constitutes a “Buy” signal. Conversely, a clear break below the line constitutes a “Sell” signal. Additionally, I use a 7.5% trailing stop loss on all positions in these categories to control downside risk.

3. All other investment arenas do not have a TTI and should be traded based on  the position of the individual ETF relative to its own respective trend line (%M/A). That’s why those signals are referred to as a “Selective Buy.” In other words, if an ETF crosses its own trendline to the upside, a “Buy” signal is generated. Since these areas tend to be more volatile, I recommend a wider trailing sell stop of 7.5% -10% depending on your risk tolerance.

If you are unfamiliar with some of the terminology, please see Glossary of Terms and new subscriber information in section 9.     

1. DOMESTIC EQUITY ETFs: BUY — since 02/13/2019

Click on chart to enlarge

Our main directional indicator, the Domestic Trend Tracking Index (TTI-green line in the above chart) is now positioned above its long-term trend line (red) by +6.87% after having generated a new Domestic “Buy” signal effective 2/13/19 as posted.

Read More