
ETF Tracker StatSheet
You can view the latest version here.
SLIDING INTO THE WEEKEND
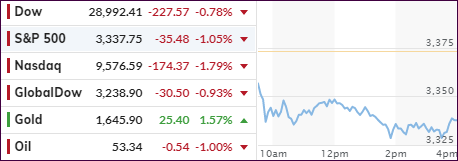
[Chart courtesy of MarketWatch.com]
- Moving the markets
More downside momentum emerged this morning, as the coronavirus fallout continues with traders finally realizing that consumer and producer sentiment has been crippled, and that even the almighty the Fed can’t just simply reboot things by printing a few trillion dollars.
Virus cases are rebounding in China and soaring in South Korea, as the flow of assets into safe havens, like gold and bonds, pulled equities off their lofty levels. Despite this being the worst down week in four, the pullback has been modest, so far.
But, as manufacturing data from around the world comes in, worries about slower economic growth, or in some cases no growth, may continue to weigh on equity markets. Hence the flight into gold and bonds, with the 30-year bond yield now scoring an all-time record low of 1.89%. Sounds like something is amiss when considering that at the same time, equities are less than 1% off record highs.
It’s clear that a supply chain disruption is a sure thing and will affect the U.S. as well, with the first indication being the PMI manufacturing index, which has collapsed into contraction.
Still, the damage for the week was relatively minor with the S&P 500 and Nasdaq surrendering -1.3% and -1.7% respectively.
So far, the major trends remain intact, and none of our trailing sell stops are close to being triggered. However, what happens if the powers to be will not reopen the liquidity spigot, as Bloomberg demonstrates in this chart?
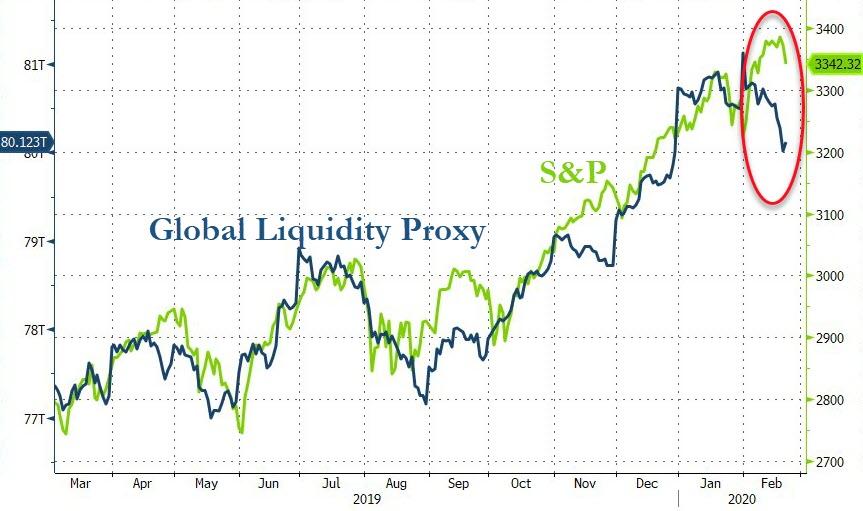
2. ETFs in the Spotlight
In case you missed the announcement and description of this section, you can again.
It features 10 broadly diversified and sector ETFs from my HighVolume list as posted every Saturday. Furthermore, they are screened for the lowest MaxDD% number meaning they
have been showing better resistance to temporary sell offs than all others over the past year.
The below table simply demonstrates the magnitude with which some of the ETFs are fluctuating regarding their positions above or below their respective individual trend lines (%+/-M/A). A break below, represented by a negative number, shows weakness, while a break above, represented by a positive percentage, shows strength.
For hundreds of ETF choices, be sure to reference Thursday’s StatSheet.
For this current domestic “Buy” cycle, here’s how some our candidates have fared:
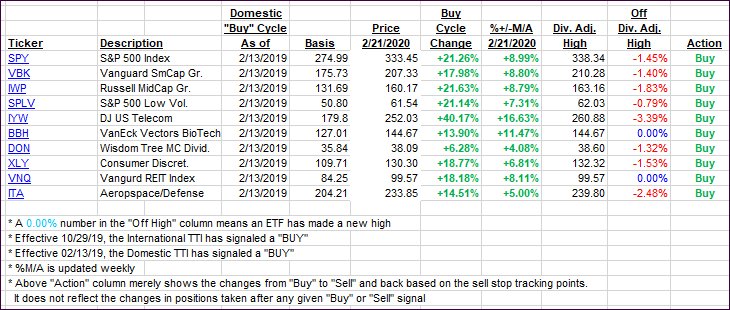
Click image to enlarge
Again, the %+/-M/A column above shows the position of the various ETFs in relation to their respective long-term trend lines, while the trailing sell stops are being tracked in the “Off High” column. The “Action” column will signal a “Sell” once the -8% point has been taken out in the “Off High” column. For more volatile sector ETFs, the trigger point is -10%.
3. Trend Tracking Indexes (TTIs)
Our Trend Tracking Indexes (TTIs) pulled back as uncertainty about the coronavirus continued unabated.
Here’s how we closed 02/21/2020:
Domestic TTI: +7.08% above its M/A (prior close +8.47%)—Buy signal effective 02/13/2019
International TTI: +4.33% above its M/A (prior close +5.53%)—Buy signal effective 10/29/2019
Disclosure: I am obliged to inform you that I, as well as my advisory clients, own some of the ETFs listed in the above table. Furthermore, they do not represent a specific investment recommendation for you, they merely show which ETFs from the universe I track are falling within the specified guidelines.
———————————————————-
WOULD YOU LIKE TO HAVE YOUR INVESTMENTS PROFESSIONALLY MANAGED?
Do you have the time to follow our investment plans yourself? If you are a busy professional who would like to have his portfolio managed using our methodology, please contact me directly or get more details here.
———————————————————
Back issues of the ETF Tracker are available on the web.
Contact Ulli