
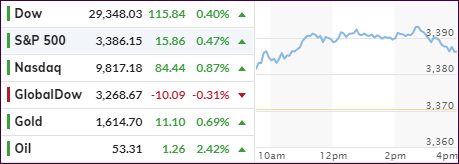
[Chart courtesy of MarketWatch.com]
- Moving the markets
With the effects of the coronavirus on everyone’s mind, China felt obliged to assure the world that it will take measures to help virus-stricken businesses by identifying weak links in supply chains. That was enough to get a rebound started with the S&P 500 and Nasdaq promptly scoring new intra-day all-time highs.
At the same
time, the Chinese claimed that the rate of new cases has allegedly started
to slow down creating optimism that the much-feared trade and travel disruptions
may not be as bad as assumed, but the WHO still has recommended caution.
Helping the rebound was the release of the Fed’s minutes indicating that officials think that the economy appeared stronger in late January than had been expected. As a result, interest rates were kept unchanged, although concerns were voiced about the threat of the coronavirus, not just in China but globally as well.
Looking at the big picture, domestic equities have kept their bullish trend intact this month, on one hand helped by positive earnings reports while, on the other, being neutralized a tad as global growth has slowed due to the effects of the virus, the full impact of which is still to be felt.
However, right now, the bullish theme continues unabated.
2. ETFs in the Spotlight
In case you missed the announcement and description of this section, you can again.
It features 10 broadly diversified and sector ETFs from my HighVolume list as posted every Saturday. Furthermore, they are screened for the lowest MaxDD% number meaning they
have been showing better resistance to temporary sell offs than all others over the past year.
The below table simply demonstrates the magnitude with which some of the ETFs are fluctuating regarding their positions above or below their respective individual trend lines (%+/-M/A). A break below, represented by a negative number, shows weakness, while a break above, represented by a positive percentage, shows strength.
For hundreds of ETF choices, be sure to reference Thursday’s StatSheet.
For this current domestic “Buy” cycle, here’s how some our candidates have fared:
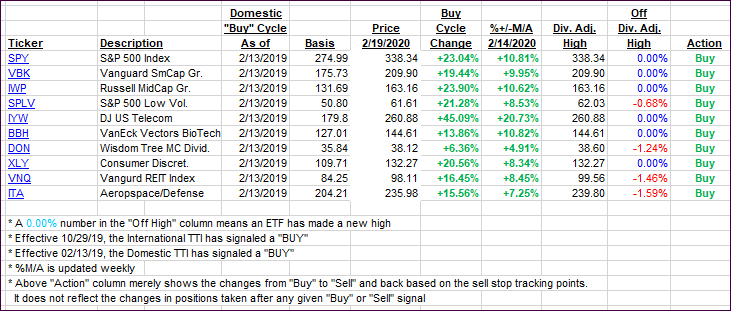
Click image to enlarge
Again, the %+/-M/A column above shows the position of the various ETFs in relation to their respective long-term trend lines, while the trailing sell stops are being tracked in the “Off High” column. The “Action” column will signal a “Sell” once the -8% point has been taken out in the “Off High” column. For more volatile sector ETFs, the trigger point is -10%.
3. Trend Tracking Indexes (TTIs)
Our Trend Tracking Indexes (TTIs) climbed as the S&P and Nasdaq scored new record highs.
Here’s how we closed 02/19/2020:
Domestic TTI: +8.47% above its M/A (prior close +8.09%)—Buy signal effective 02/13/2019
International TTI: +5.53% above its M/A (prior close +5.17%)—Buy signal effective 10/29/2019
Disclosure: I am obliged to inform you that I, as well as my advisory clients, own some of the ETFs listed in the above table. Furthermore, they do not represent a specific investment recommendation for you, they merely show which ETFs from the universe I track are falling within the specified guidelines.
Contact Ulli