
[Chart courtesy of MarketWatch.com]
- Moving the markets
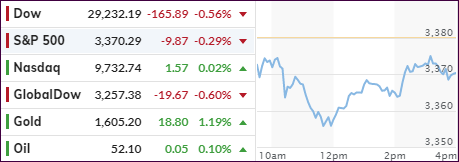
Powerhouse Apple Inc. pulled the plug on Wall Street this morning, after announcing that its second quarter results may be impacted by the virus outbreak in China.
This in turn stoked fears again that any potential interruptions of supply chains will have far-reaching consequences not just for worldwide economies but also the financial markets.
Apple clearly stated that its monetary guidance for the second quarter will not be met, because its suppliers’ manufacturing has been affected, but discussions with health experts and suppliers continue full force.
Sure, Wall Street expected some of these announcements, but the magnitude of it came as a surprise. However, financial markets don’t like surprises, hence the sell-off today. In other words, the always optimistic traders, who had shaken off concerns about the disease, are now facing a dose of reality.
While the mid-day recovery pulled the indexes off their worst levels, only the Nasdaq managed to gather enough steam to close in the green.
Still, it’s amazing when the world’s largest company, Apple, issues a warning on a holiday about the unknown fallout from the coronavirus, and the markets barely seem to notice, as the mid-session drop caused dip buyers to step in to “save” the bullish theme.
2. ETFs in the Spotlight
In case you missed the announcement and description of this section, you can again.
It features 10 broadly diversified and sector ETFs from my HighVolume list as posted every Saturday. Furthermore, they are screened for the lowest MaxDD% number meaning they
have been showing better resistance to temporary sell offs than all others over the past year.
The below table simply demonstrates the magnitude with which some of the ETFs are fluctuating regarding their positions above or below their respective individual trend lines (%+/-M/A). A break below, represented by a negative number, shows weakness, while a break above, represented by a positive percentage, shows strength.
For hundreds of ETF choices, be sure to reference Thursday’s StatSheet.
For this current domestic “Buy” cycle, here’s how some our candidates have fared:
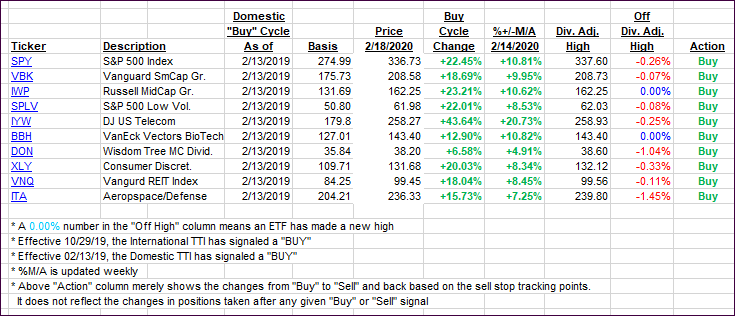
Click image to enlarge
Again, the %+/-M/A column above shows the position of the various ETFs in relation to their respective long-term trend lines, while the trailing sell stops are being tracked in the “Off High” column. The “Action” column will signal a “Sell” once the -8% point has been taken out in the “Off High” column. For more volatile sector ETFs, the trigger point is -10%.
3. Trend Tracking Indexes (TTIs)
Our Trend Tracking Indexes (TTIs) slipped as Apple’s news kept the markets in a state of uncertainty.
Here’s how we closed 02/18/2020:
Domestic TTI: +8.09% above its M/A (prior close +8.42%)—Buy signal effective 02/13/2019
International TTI: +5.17% above its M/A (prior close +5.80%)—Buy signal effective 10/29/2019
Disclosure: I am obliged to inform you that I, as well as my advisory clients, own some of the ETFs listed in the above table. Furthermore, they do not represent a specific investment recommendation for you, they merely show which ETFs from the universe I track are falling within the specified guidelines.
Contact Ulli