ETF Tracker Newsletter For December 27, 2019

Ulli ETF Tracker Contact

ETF Tracker StatSheet          

You can view the latest version here.

SANTA CLAUS RALLY CONTINUES

[Chart courtesy of MarketWatch.com]
  1. Moving the markets

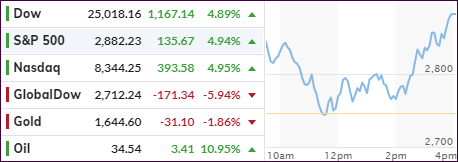
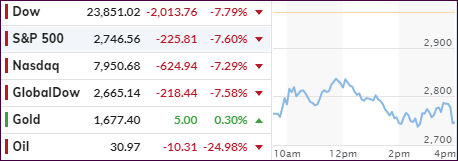
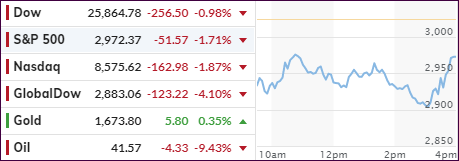
The markets continued their torrid pace into record territory, although momentum faded into the close today with the S&P 500 slipping just a tad but closing higher by +0.59% during this Holiday-shortened week.

As ZH pointed out, it’s been a year of buying everything:

  • S&P’s best year since 1997
  • Gold’s best year since 2010
  • Bond’s best year since 2014

Of course, as I mentioned ad nauseum, the magic behind this rally was the largesse of not only the Fed but Central Banks in general, who for 2019 provided some $5 trillion dollars in liquidity, as interest rates traveled towards negative territory.

Presidential candidate Trump seemed to recognize this abnormality when back on 9/5/16, he said:

“They’re keeping the rates down so that everything else doesn’t go down… The only thing that is strong is the artificial stock market.”

That also explains how the S&P 500 can be up almost 30%, while earnings expectations are down almost 5% on the year, as ZH elaborates.

Be that as it may, the bullish trend remains firmly in place, and we will stay abord until that fact changes.

Read More

Weekly StatSheet For The ETF Tracker Newsletter – Updated Through 12/26/2019

Ulli ETF StatSheet Contact

ETF Data updated through Thursday, December 26, 2019

Methodology/Use of this StatSheet:

1. From the universe of over 1,800 ETFs, I have selected only those with a trading volume of over $5 million per day (HV ETFs), so that liquidity and a small bid/ask spread are assured.

2. Trend Tracking Indexes (TTIs)

Buy or Sell decisions for Domestic and International ETFs (section 1 and 2), are made based on the respective TTI and its position either above or below its long-term M/A (Moving Average). A crossing of the trend line from below accompanied by some staying power above constitutes a “Buy” signal. Conversely, a clear break below the line constitutes a “Sell” signal. Additionally, I use a 7.5% trailing stop loss on all positions in these categories to control downside risk.

3. All other investment arenas do not have a TTI and should be traded based on  the position of the individual ETF relative to its own respective trend line (%M/A). That’s why those signals are referred to as a “Selective Buy.” In other words, if an ETF crosses its own trendline to the upside, a “Buy” signal is generated. Since these areas tend to be more volatile, I recommend a wider trailing sell stop of 7.5% -10% depending on your risk tolerance.

If you are unfamiliar with some of the terminology, please see Glossary of Terms and new subscriber information in section 9.     

1. DOMESTIC EQUITY ETFs: BUY — since 02/13/2019

Click on chart to enlarge

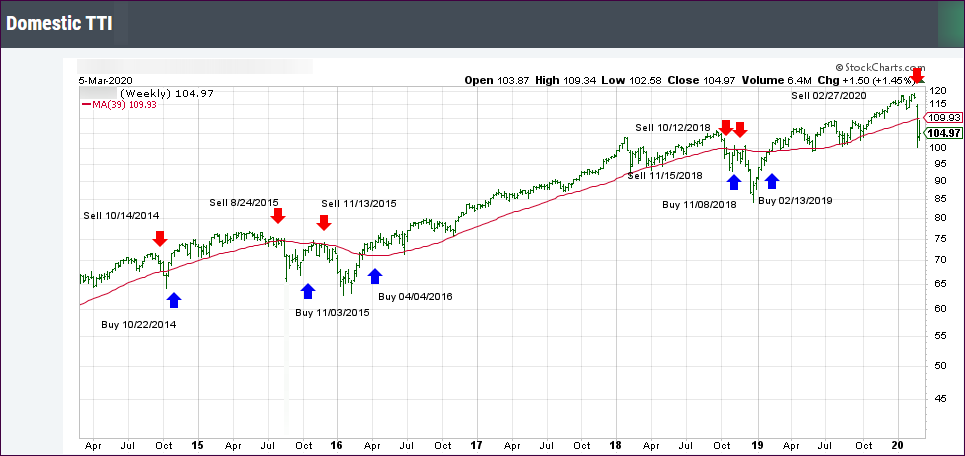
Our main directional indicator, the Domestic Trend Tracking Index (TTI-green line in the above chart) is now positioned above its long-term trend line (red) by +7.72% after having generated a new Domestic “Buy” signal effective 2/13/19 as posted.

Read More

Crawling Higher

Ulli Market Commentary Contact

[Chart courtesy of MarketWatch.com]
  1. Moving the markets

The Dow was the beneficiary of today’s news that Boeing’s CEO has “resigned” and was replaced by its current Chairman. This contributed at least 50 points to initial 100-point surge.

The major indexes crept into new record territory also supported by news that China intends cut its tariffs for pork, pharmaceuticals and some high-tech components starting January 1, 2020.

This appears to be the latest sign that US and China are finally serious in completing the partial trade agreement after 2 years of mudslinging and jawboning, which affected global and domestic economies. Maybe, just maybe, we are seeing some de-escalation of tensions.

In the domestic arena, we learned that Existing Home Sales unexpectedly slipped in November, while New Home Sales surprised to the upside with a +1.3% MoM gain. Durable Goods orders also did the unexpected, namely plunging -2% MoM vs. expectations of +1.5% MoM, which translates to a YoY breakdown of -5.7%; the worst since 2016.

But, most of those things no longer matter, and in the end, the major indexes eked out another gain, although on below average volume. The Dow lead the pack, while the S&P scored 8 record intraday highs in a row, its longest streak since 1998 (14 days).

The markets will have a shortened session tomorrow and on Thursday, so I will not write a commentary on those two days. However, I will post the StatSheet as usual and write Friday’s wrap up, which is then followed by the “ETFs on the Cutline” post on Saturday.

I wish you a Merry Christmas.

Ulli…

Read More

ETFs On The Cutline – Updated Through 12/20/2019

Ulli ETFs on the Cutline Contact

Below, please find the latest High-Volume ETF Cutline report, which shows how far above or below their respective long-term trend lines (39-week SMA) my currently tracked ETFs are positioned.

This report covers the HV ETF Master List from Thursday’s StatSheet and includes 322 High Volume ETFs, defined as those with an average daily volume of more than $5 million, of which currently 283 (last week 284) are hovering in bullish territory. The yellow line separates those ETFs that are positioned above their trend line (%M/A) from those that have dropped below it.

Take a look:                                                                   

The HV ETF Master Cutline Report

In case you are not familiar with some of the terminology used in the reports, please read the Glossary of Terms.

If you missed the original post about the Cutline approach, you can read it here.               

ETF Tracker Newsletter For December 20, 2019

Ulli ETF Tracker Contact

ETF Tracker StatSheet          

You can view the latest version here.

SLOW AND STEADY

[Chart courtesy of MarketWatch.com]
  1. Moving the markets

The major indexes continued their upward trend, slow and steady, as we’ve seen all week, which is preferable over fast and furious moves followed by quick and sharp corrections.  

Today’s melt up was in part caused by quadruple options expirations creating more volatility than we’ve seen during the recent past. You could say that the options market “tail” was wagging the US equity market “dog” once again as ZH quipped.

While not earthshattering but market pleasing, was the final Q3 GDP revision, which remained unchanged at 2.1% and represents a fractional rise from the 2% in Q2.

The always present fears of a potential downward adjustment have now been alleviated, which contributed to market stability. Also helping the indexes push higher was a report that Personal Incomes, after a slowdown in October, grew at the fastest pace of 2019, while spending accelerated as well.

Mixed news came from the “Retailpocalypse” with data showing that so far 9,300 stores have closed across the US in 2019, which is a 59% increase over 2018. This clearly represents a change of the times we are living in, during which the physical department stores are only of limited value for shoppers with the many online options being the preferred mode of operation. Sad or not, it is a fact.  

In the end, the major indexes touched record intraday highs before fading into the close. This Friday marks the fourth straight week of gains with the S&P 500 adding +1.6% over the past 5 trading days. Right now, the bull looks to be alive and well, while the bears seemed to have gone into hibernation—at least for the moment.

Why is that? You should know by now, that the driver of this relentless melt up has been and remains global liquidity, as this chart from Bloomberg shows. Otherwise, how would it be possible for the S&P to have gained so substantially this year, while earnings expectations have slid almost 5%?

Read More

Weekly StatSheet For The ETF Tracker Newsletter – Updated Through 12/19/2019

Ulli ETF StatSheet Contact

ETF Data updated through Thursday, December 19, 2019

Methodology/Use of this StatSheet:

1. From the universe of over 1,800 ETFs, I have selected only those with a trading volume of over $5 million per day (HV ETFs), so that liquidity and a small bid/ask spread are assured.

2. Trend Tracking Indexes (TTIs)

Buy or Sell decisions for Domestic and International ETFs (section 1 and 2), are made based on the respective TTI and its position either above or below its long-term M/A (Moving Average). A crossing of the trend line from below accompanied by some staying power above constitutes a “Buy” signal. Conversely, a clear break below the line constitutes a “Sell” signal. Additionally, I use a 7.5% trailing stop loss on all positions in these categories to control downside risk.

3. All other investment arenas do not have a TTI and should be traded based on  the position of the individual ETF relative to its own respective trend line (%M/A). That’s why those signals are referred to as a “Selective Buy.” In other words, if an ETF crosses its own trendline to the upside, a “Buy” signal is generated. Since these areas tend to be more volatile, I recommend a wider trailing sell stop of 7.5% -10% depending on your risk tolerance.

If you are unfamiliar with some of the terminology, please see Glossary of Terms and new subscriber information in section 9.     

1. DOMESTIC EQUITY ETFs: BUY — since 02/13/2019

Click on chart to enlarge

Our main directional indicator, the Domestic Trend Tracking Index (TTI-green line in the above chart) is now positioned above its long-term trend line (red) by +7.61% after having generated a new Domestic “Buy” signal effective 2/13/19 as posted.

Read More