Stimulus Hopes Pull Stocks Out Of The Doldrums

Ulli Market Commentary Contact

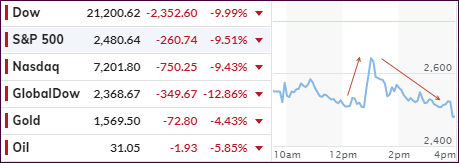
[Chart courtesy of MarketWatch.com]

  1. Moving the markets

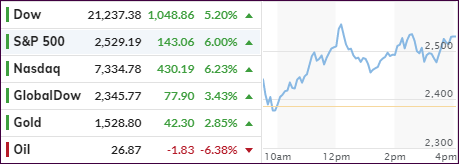
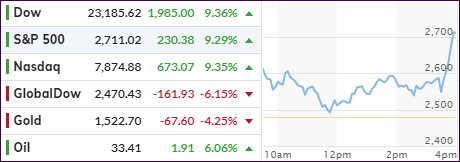
Equities managed a nice bounce today powered higher by news that the Trump administration asked for a $1 trillion fiscal stimulus package to mitigate the fallout effects from the coronavirus. News that the Fed moved to support the commercial paper market via providing short-term funding needs, also gave an assist and elevated sentiment.

After getting slaughtered yesterday, the major indexes staged a nice rebound wiping out some of yesterday’s losses yet being far away from establishing a new bullish trend.

Some of the measures the government is evaluating to help combat the effects of the virus includes deferral of tax payments, sending checks directly to the populace, also known as helicopter money, and keeping the financial markets open and functioning.

Whether all these efforts will have the desired effect remains to be seen, especially on the Fed’s part, where despite intervention, banking liquidity worsened. At the same time, the 10-year yield spiked back above 1%, up a substantial 30bps from the lows of the day. Something still does not make sense in the overnight lending market.  

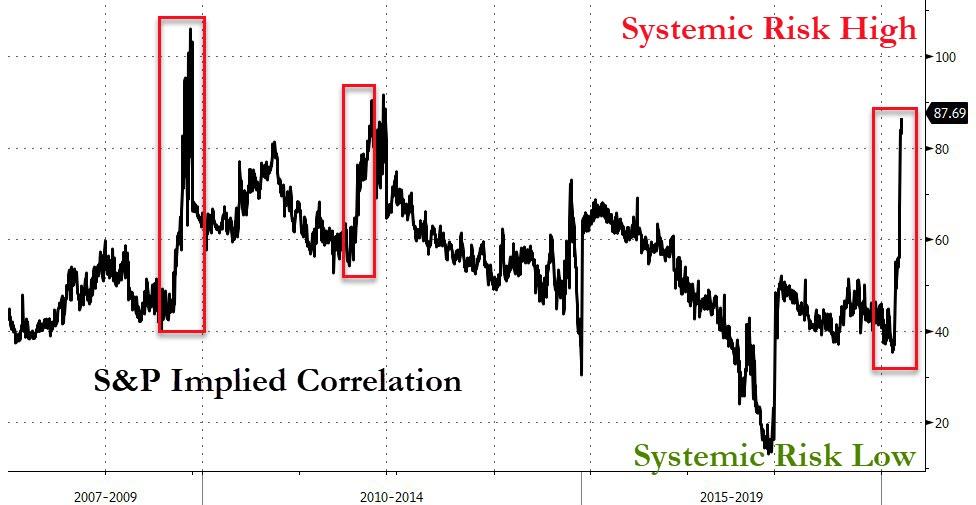
All this has affected equities, where we have witnessed 3%+ moves in the S&P 500 during 13 of the past 22 trading days, approaching the October 2008 experience, according to ZH. Systemic risk levels continue to soar, as Bloomberg points out here.

Safety is number one in my book where, during these trying times, the return of our capital ranks higher than the return on our capital.

Read More
Fed Unloads Its Biggest Bazooka Ever—Markets Crash—Dow Plunges 3,000 Points

Ulli Market Commentary Contact

[Chart courtesy of MarketWatch.com]

  1. Moving the markets

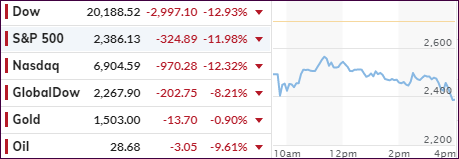
When I was watching the futures markets last night, I already knew that today would not be a good one to be in the markets. Despite the Fed unloading its biggest emergency bazooka ever, by announcing $700 billion in QE and a full 1% reduction in interest rates to “zero,” markets immediately went limit down.

We all know that the Fed’s FOMC meeting was scheduled for this coming Tuesday/Wednesday, and they could not wait 3 extra days to announce their decision?

So, they rushed to do it Sunday night just prior to the futures markets opening. This smelled like a panic move, and the markets took it as such and started the session limit down.

This morning, things did not look better, and the circuit breakers kicked in, as @GreekFire23 summed up:

  1. 9:30am: Ding Ding Ding! Trading open!
  2. 9:30:00001am: Halted

That represents the speed with which we hit limit down. In other words, Friday’s much hyped rebound turned into another dead-cat-bounce, with the major indexes getting slaughtered today by dropping around -12% with the Dow being the worst performer with -12.93%, or just about -3,000 points.

Or, looking at it from another viewpoint, Small Caps and Transportations are down -35% from their highs, and the rest of the majors down around -27%, according to ZH.

We have now seen 2 massive global monetary interventions, and they resulted in a total bloodbath for the markets—and this may only be the beginning.

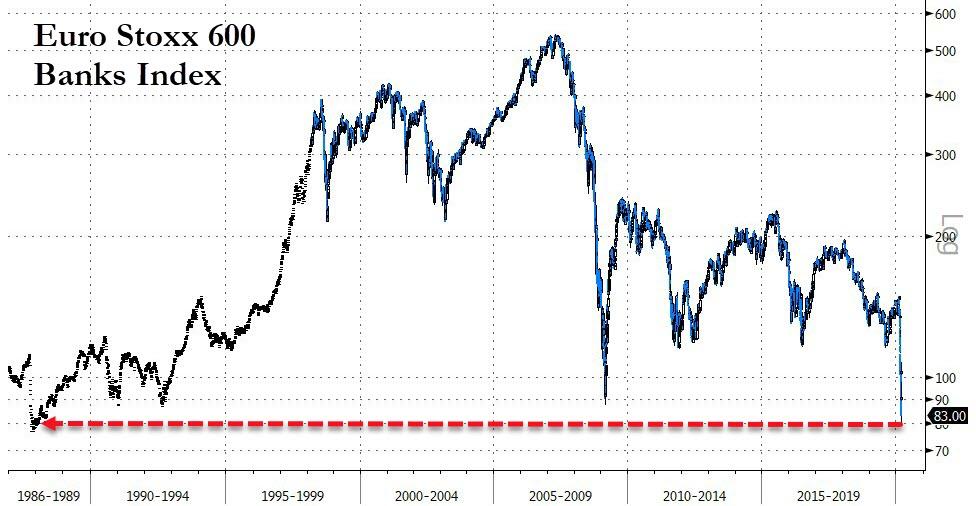
The carnage was worldwide, with banking stocks in Europe now smashed to a level last seen in 1987, as Bloomberg shows.

The question now is, will the December 2018 lows of the S&P 500 hold? If not, we are bound to go a lot lower.

I am sure, this week will have a lot more surprises in store with many Buy-and-Holders wishing that they had joined us on the sidelines on 2/27.

Read More

ETFs On The Cutline – Updated Through 03/13/2020

Ulli ETFs on the Cutline Contact

Below, please find the latest High-Volume ETF Cutline report, which shows how far above or below their respective long-term trend lines (39-week SMA) my currently tracked ETFs are positioned.

This report covers the HV ETF Master List from Thursday’s StatSheet and includes 322 High Volume ETFs, defined as those with an average daily volume of more than $5 million, of which currently 31 (last week 91) are hovering in bullish territory. The yellow line separates those ETFs that are positioned above their trend line (%M/A) from those that have dropped below it.

Take a look:                                                                   

The HV ETF Master Cutline Report

In case you are not familiar with some of the terminology used in the reports, please read the Glossary of Terms. If you missed the original post about the Cutline approach, you can read it here.      

ETF Tracker Newsletter For March 13, 2020

Ulli ETF Tracker Contact

ETF Tracker StatSheet          

You can view the latest version here.

ENDING A BRUTAL WEAK WITH A RELIEF RALLY

[Chart courtesy of MarketWatch.com]

  1. Moving the markets

The markets finally managed to keep a rebound rally going after yesterday’s collapse. As I posted, during bear markets, you can witness violent upswings, but they don’t mean the bearish trend is over.

Today, we started in the green, as news from Europe that the German FinMin unleashed their version of a financial bazooka and presented their “whatever it takes moment:”

  1. SCHOLZ SAYS POSSIBLE GERMANY WILL NEED TO TAKE ON ADDED DEBT;
  2. GERMANY WILL HAVE NO LIMIT ON CREDIT PROGRAM FOR COMPANIES;
  3. SCHOLZ SAYS GERMANY WILL SPEND BILLIONS TO CUSHION ECONOMY;
  4. GERMANY PLANS TO SET UP SAFETY NET FOR VIRUS-HIT COMPANIES;
  5. ALTMAIER: RESOURCES FOR GERMANY’S STATE BANK TO RISE TO 500BN

That set the bullish tone for the day, and up we went. Adding hope for a quick response domestically were reports that House Speaker Pelosi and the Trump Administration were nearing an agreement on an aid package, to include sick pay free virus testing and other resources.

Then it was the Fed’s turn to announce their “whatever it takes moment,” by attempting to restore some liquidity in the broken overnight lending market by concluding three of six emergency POMOs (Permanent Open Market Operations) and soaking up billions of Treasuries of varying maturities.

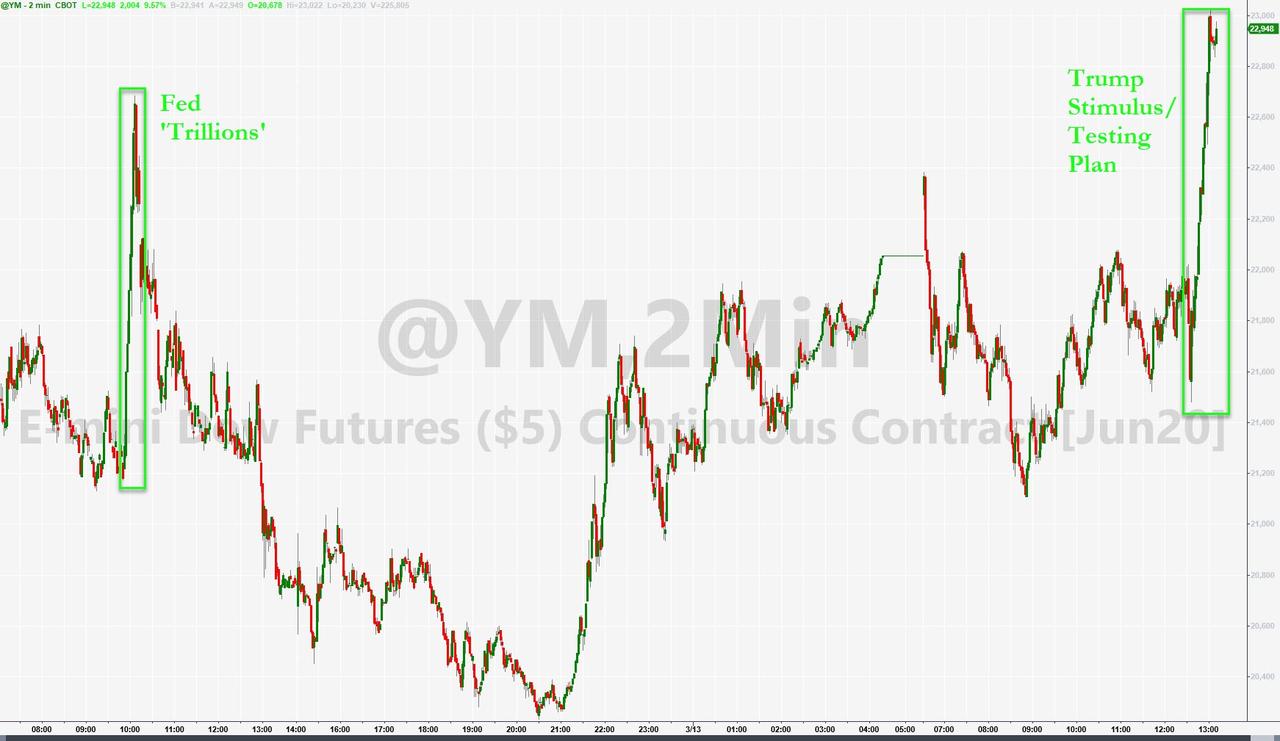
Towards session end, it was Trump’s stimulus/testing plan that spiked equities to their biggest gain since October 2008, thereby somewhat offsetting the market’s worst week since 2008, during which the S&P 500 dropped -8.8%.

Even diversification did not help, as this week was the worst weekly loss for a diversified portfolio of stocks and bonds since 2008 with -14.69%, as Bloomberg points out in this chart.

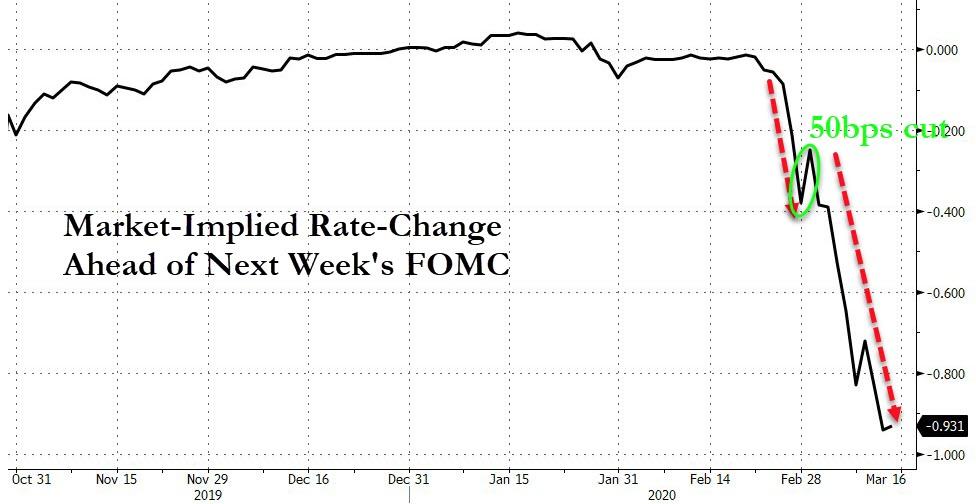
Next week, the Fed will meet, and the markets are “demanding” a full 1% interest rate cut with Bloomberg providing the graphic representation. You can be pretty much assured that the Fed will cave and comply, otherwise the current debacle will continue in an accelerated fashion.

Read More

Weekly StatSheet For The ETF Tracker Newsletter – Updated Through 03/12/2020

Ulli ETF Tracker Contact

ETF Data updated through Thursday, March 12, 2020

Methodology/Use of this StatSheet:

1. From the universe of over 1,800 ETFs, I have selected only those with a trading volume of over $5 million per day (HV ETFs), so that liquidity and a small bid/ask spread are assured.

2. Trend Tracking Indexes (TTIs)

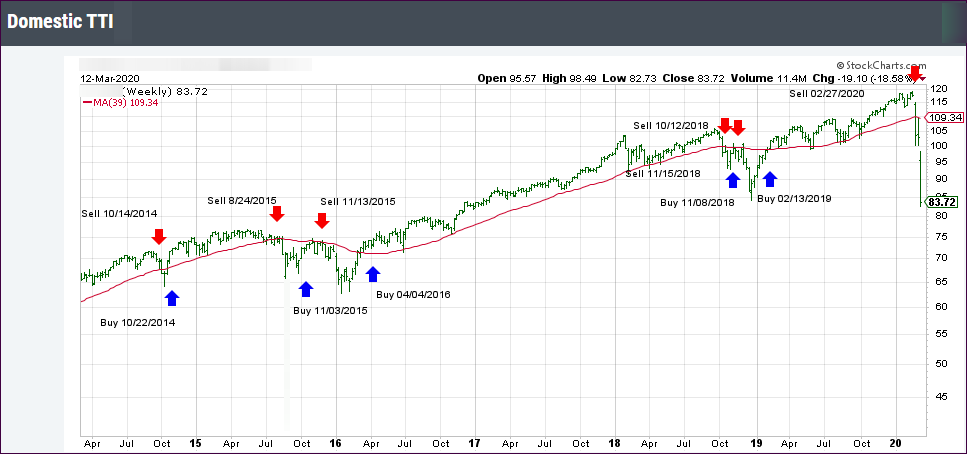
Buy or Sell decisions for Domestic and International ETFs (section 1 and 2), are made based on the respective TTI and its position either above or below its long-term M/A (Moving Average). A crossing of the trend line from below accompanied by some staying power above constitutes a “Buy” signal. Conversely, a clear break below the line constitutes a “Sell” signal. Additionally, I use a 7.5% trailing stop loss on all positions in these categories to control downside risk.

3. All other investment arenas do not have a TTI and should be traded based on  the position of the individual ETF relative to its own respective trend line (%M/A). That’s why those signals are referred to as a “Selective Buy.” In other words, if an ETF crosses its own trendline to the upside, a “Buy” signal is generated. Since these areas tend to be more volatile, I recommend a wider trailing sell stop of 7.5% -10% depending on your risk tolerance.

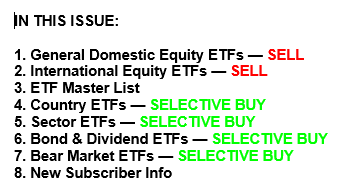
If you are unfamiliar with some of the terminology, please see Glossary of Terms and new subscriber information in section 9.     

1. DOMESTIC EQUITY ETFs: SELL — since 02/27/2020

Click on chart to enlarge

Our main directional indicator, the Domestic Trend Tracking Index (TTI-green line in the above chart) is now positioned below its long-term trend line (red) by -23.80% after having generated a new Domestic “Sell” signal effective 2/27/20 as posted.

Read More

The Bull Dies Of Morbid Obesity—The Bear Roars—The Crash Fest Continues

Ulli Market Commentary Contact

[Chart courtesy of MarketWatch.com]

  1. Moving the markets

In a few decades, historians will look back at the past 10 years and shake their heads in disbelieve at the insane Fed monetary policies that have kept markets artificially propped up, while “disallowing” any downside moves beyond a certain “acceptable” percentage.

Though many erroneously attribute the current market disaster to the coronavirus, that is incorrect. The virus was merely the pin that pricked the ever-growing bubbles, which would have burst anyway, but we might have pushed the can down the road a little longer.

ZH and others posted these relevant commentaries:

  1. This bull market will go down in history as the one that nobody believed would last this long. A lot of people have been hurt because their retirement money disappeared…. What brought us to where we are in 2020 is too much hope, sky-high valuations.
  2. Did I see it coming this far? No. Throughout the past 11 years, the market has had a lot of dips, and always the Federal Reserve came to the rescue…. Right now, the Fed is not enough, central bank action is not enough. There is a pyramid of uncertainty right now.
  3. Does the Fed really want to have a put every time the market gets nervous? …Coming off all-time highs, does it make sense for The Fed to bail the markets out every single time… creating a trap?
  4. The Fed has created this dependency and there’s an entire generation of money-managers who … have only seen a one-way street… of course they’re nervous.
  5. The question is – do you want to feed that hunger? Keep applying that opioid of cheap and abundant money?
  6. The market is dependent on Fed largesse… and we made it that way…

At this moment, the crash fest goes on with utter abandon causing one analyst to ask:

“Is the market now like an “Oriental Rug Factory” where “Everything Must Go?”

It certainly feels that way now, as many leveraged traders are forced to unwind and sell everything, including safe-haven assets like precious metals, in order to meet margin calls.

Of course, in bear markets we can witness and sharp rebounds of great magnitude, but that does not mean a new bull market is imminent. Case in point was today, when the Fed fired a bazooka by unleashing a $1.5 trillion Rep bailout, which means up to $3 trillion in cumulative repos by the end of the month.

The effect was immediate, as the above chart shows, with the Dow regaining some 1,500 points within minutes. Unfortunately, this was merely a dead cat bounce, and the markets resumed their downward trajectory with utter abandon leaving me pondering as to whether the Fed has finally run out of ammunition.

However, I expect them to drop rates to zero, or below, and directly intervene in the markets, just like the Japanese Central Bank does, by openly buying stocks, bonds and ETFs. We will find out soon.

Yes, the thing that may have been unthinkable 3 weeks ago is upon us. The bear market has arrived with full force and may be hanging around for a while.

Being out of the market and on the sidelines never felt so right.

Read More