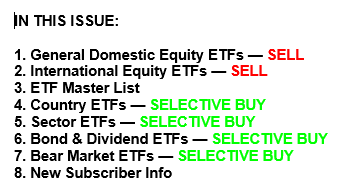
Weekly StatSheet For The ETF Tracker Newsletter – Updated Through 01/09/2020

Ulli ETF Tracker Contact

ETF Data updated through Thursday, January 9, 2020

Methodology/Use of this StatSheet:

1. From the universe of over 1,800 ETFs, I have selected only those with a trading volume of over $5 million per day (HV ETFs), so that liquidity and a small bid/ask spread are assured.

2. Trend Tracking Indexes (TTIs)

Buy or Sell decisions for Domestic and International ETFs (section 1 and 2), are made based on the respective TTI and its position either above or below its long-term M/A (Moving Average). A crossing of the trend line from below accompanied by some staying power above constitutes a “Buy” signal. Conversely, a clear break below the line constitutes a “Sell” signal. Additionally, I use a 7.5% trailing stop loss on all positions in these categories to control downside risk.

3. All other investment arenas do not have a TTI and should be traded based on  the position of the individual ETF relative to its own respective trend line (%M/A). That’s why those signals are referred to as a “Selective Buy.” In other words, if an ETF crosses its own trendline to the upside, a “Buy” signal is generated. Since these areas tend to be more volatile, I recommend a wider trailing sell stop of 7.5% -10% depending on your risk tolerance.

If you are unfamiliar with some of the terminology, please see Glossary of Terms and new subscriber information in section 9.     

1. DOMESTIC EQUITY ETFs: BUY — since 02/13/2019

Click on chart to enlarge

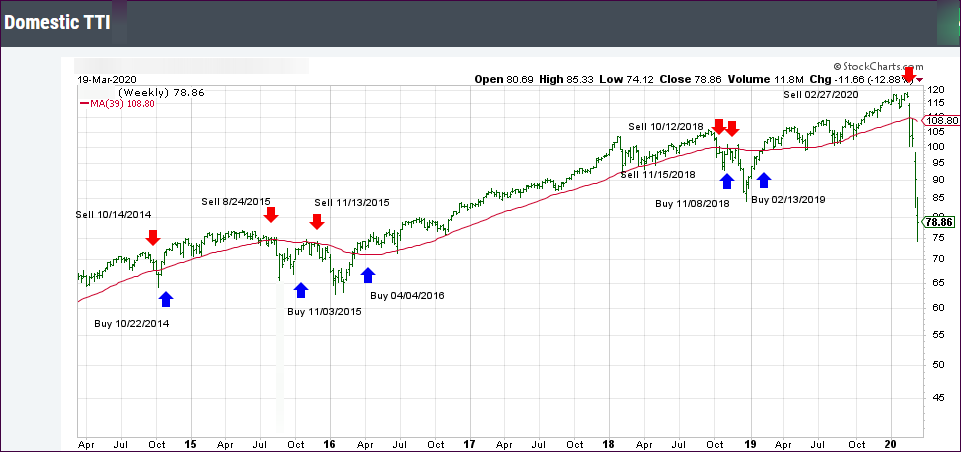
Our main directional indicator, the Domestic Trend Tracking Index (TTI-green line in the above chart) is now positioned above its long-term trend line (red) by +8.00% after having generated a new Domestic “Buy” signal effective 2/13/19 as posted.

Read More

And The Bullish Beat Goes On

Ulli Market Commentary Contact

[Chart courtesy of MarketWatch.com]
  1. Moving the markets

After the opening bell, the major indexes continued their attack into record territory, as the attention moved from Iran to the latest in the U.S.-China trade agreement.

It appeared that the tensions in the Middle East eased somewhat, as the war rhetoric seemed to have slowed down, or at least has been put on the back burner for the time being. Trump’s comments yesterday that he wasn’t pushing for an all-out war with Iran, was a relief for traders and resulted in a continuation of the rebound.

The trade deal now took front and center again with China’s Vice Premier He scheduled to lead a delegation to Washington next week to sign the Phase 1 agreement, which supported the current bullish market mood.

In the meantime, the Fed’s vice chairman Clarida announced that the economy “was on solid ground,” but emphasized that the Fed’s interest rate policy may be changed at any meeting. Surprisingly, this statement did not have a negative market moving effect.

In the end, the major indexes melted up again with the S&P’s forward PE now at 18.5x, which is its highest since the dotcom bust, according to ZH.

It simply confirms that fundamental evaluations no longer matter, until one day, they do. Until then, what matters are the coordinated efforts by the Central Banks to maintain low to negative interest rates and making sure an abundance of liquidity, AKA the #1 market driver, is always available.

Read More

Climbing A Wall Of Worry—And Setting New Records

Ulli Market Commentary Contact

[Chart courtesy of MarketWatch.com]
  1. Moving the markets

Despite a sharp sell-off overnight in the futures market, which pulled the Dow down some 400 points, the negative mood had completely changed by the time regular session bell rang.

We opened slightly higher with upward momentum gaining steam, after remarks by Trump suggested that the U.S. and the Iranian were refraining from further military action.

He further minimized Tuesday’s attack by elaborating that no U.S. casualties were sustained, and only “minimal’ damage was done to U.S. military facilities in Iraq.

In the end, the market’s initial “risk-off” reaction reversed in no time sending the S&P 500 and Nasdaq into record territory, although both indexes came off their highs and slipped into the close. On the downside, crude oil was hammered, as the de-escalation theme ruled the day.

On the economic front we learned that private sector employment data from ADP showed that 202,000 new jobs were added in December, which was above the expected number of 157,000. We’ll have to wait and see if Friday’s employment report supports that trend as well.

AS ZH posted, “from WW3 to record highs in 12 hours, as missiles flew and so did tweets and now all is well again.”

I am sure there will be more to this story, as time goes on.

Read More

Middle East Concerns Remain Front And Center

Ulli Market Commentary Contact

[Chart courtesy of MarketWatch.com]
  1. Moving the markets

The major indexes opened lower and bobbed and weaved below their respective unchanged lines through the entire session, with only the Nasdaq spending some time above it, but it did not manage to hold on to early gains.

For sure, the ongoing concerns about a potential war in the Middle East have kept markets in check, but the selloffs have been minor, with dip buyers lurking on deck ready to pick up assets at lower prices.

Some MSM headlines have been screaming WW III for the past week and, while I am sure the tit for tat will continue, it’s unlikely that it will turn into a full-blown war, that is, if history is any indication. Over the past 200 years, Iranians have never started a war, although they have defended themselves on numerous occasions. I don’t see this changing, but you can never be certain.

During the recent moderate pullbacks, it has become clear that low volatility ETFs, like SPLV, which we own, have held up poorly. Case in point was today, when SPY gave back -0.28% while SPLV dropped -0.59%, or more than twice as much.

That has been a recurring and disturbing theme lately, which is why in my advisor practice we have lightened up considerably on its holdings and may shed even more. Something is simply wrong when an ETF does not live up to its functionality, namely showing improved resistance to sell-offs. For sure, SPLV has lost the luster shown during the first 9 months of 2019.

With earnings season not too far away, I am curious to see if a better 2020, as priced in last year, can become reality. If not, the savior for the bulls can always be Global Liquidity, as this chart shows.

Read More

Bouncing Off The Lows

Ulli Market Commentary Contact

[Chart courtesy of MarketWatch.com]
  1. Moving the markets

Despite the escalating tensions in the Middle East, the markets appeared to be looking past the beating of the war drums and dug themselves out of an early hole. The initial dump did not hold, and a slow but steady ascent towards the unchanged line was followed by a late burst to assure a green close for the major indexes.

The appetite for stocks had been somewhat tempered over the past few trading days due to the unknown implications of the death of the Iranian general last week. This uncertainty was supported by higher oil prices and fears what the global fallout might be, should the Iranians close the Straits of Hormuz.

However, overriding these issues is the fact that the assumed to be all powerful Fed will continue their accommodative monetary policy in 2020, despite the US being almost certain to get the Phase-1 trade deal with China signed, which is to be finalized by January 15.

Despite likely occasional market sell-offs, the general environment for equities leading up to the election looks positive, that is, until a Black Swan event causes the major market trend to change from bullish to bearish, which then will be the time to apply our exit strategy and head for the safety of the sidelines.

Read More

ETFs On The Cutline – Updated Through 01/03/2020

Ulli ETFs on the Cutline Contact

Below, please find the latest High-Volume ETF Cutline report, which shows how far above or below their respective long-term trend lines (39-week SMA) my currently tracked ETFs are positioned.

This report covers the HV ETF Master List from Thursday’s StatSheet and includes 322 High Volume ETFs, defined as those with an average daily volume of more than $5 million, of which currently 291 (last week 284) are hovering in bullish territory. The yellow line separates those ETFs that are positioned above their trend line (%M/A) from those that have dropped below it.

Take a look:                                                                   

The HV ETF Master Cutline Report

In case you are not familiar with some of the terminology used in the reports, please read the Glossary of Terms. If you missed the original post about the Cutline approach, you can read it here.