
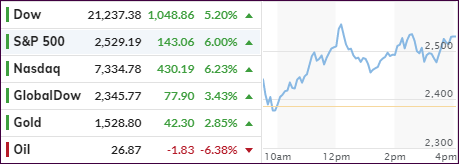
[Chart courtesy of MarketWatch.com]
- Moving the markets
Equities managed a nice bounce today powered higher by news that the Trump administration asked for a $1 trillion fiscal stimulus package to mitigate the fallout effects from the coronavirus. News that the Fed moved to support the commercial paper market via providing short-term funding needs, also gave an assist and elevated sentiment.
After getting slaughtered yesterday, the major indexes staged a nice rebound wiping out some of yesterday’s losses yet being far away from establishing a new bullish trend.
Some of the measures the government is evaluating to help combat the effects of the virus includes deferral of tax payments, sending checks directly to the populace, also known as helicopter money, and keeping the financial markets open and functioning.
Whether all these efforts will have the desired effect remains to be seen, especially on the Fed’s part, where despite intervention, banking liquidity worsened. At the same time, the 10-year yield spiked back above 1%, up a substantial 30bps from the lows of the day. Something still does not make sense in the overnight lending market.
All this has affected equities, where we have witnessed 3%+ moves in the S&P 500 during 13 of the past 22 trading days, approaching the October 2008 experience, according to ZH. Systemic risk levels continue to soar, as Bloomberg points out here.
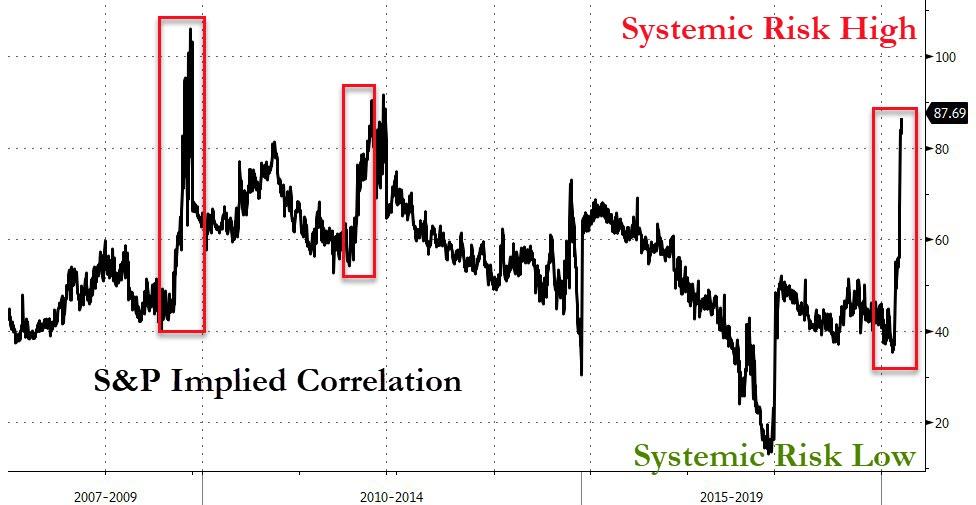
Safety is number one in my book where, during these trying times, the return of our capital ranks higher than the return on our capital.
2. ETFs in the Spotlight
In case you missed the announcement and description of this section, you can again.
It features 10 broadly diversified and sector ETFs from my HighVolume list as posted every Saturday. Furthermore, they are screened for the lowest MaxDD% number meaning they have been showing better resistance to temporary sell offs than all others over the past year.
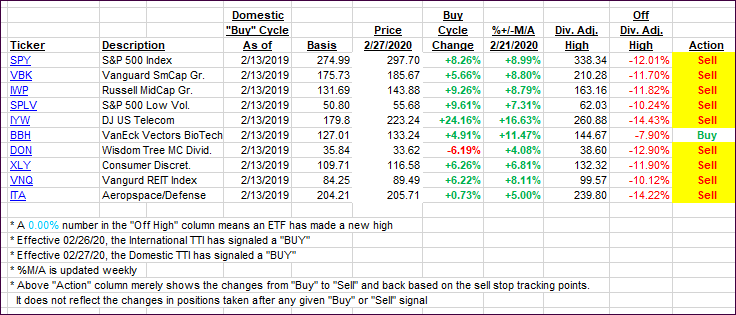
The below table simply demonstrates the magnitude with which some of the ETFs are fluctuating regarding their positions above or below their respective individual trend lines (%+/-M/A). A break below, represented by a negative number, shows weakness, while a break above, represented by a positive percentage, shows strength.
For hundreds of ETF choices, be sure to reference Thursday’s StatSheet.
For this past domestic “Buy” cycle, which ended on 2/27/2020, here’s how some our candidates have fared:
Click image to enlarge
Again, the %+/-M/A column above shows the position of the various ETFs in relation to their respective long-term trend lines, while the trailing sell stops are being tracked in the “Off High” column. The “Action” column will signal a “Sell” once the -8% point has been taken out in the “Off High” column. For more volatile sector ETFs, the trigger point is -10%.
3. Trend Tracking Indexes (TTIs)
Our TTIs imploded recovered with the markets but are still deeply entrenched in bear market territory.
Here’s how we closed 03/17/2020:
Domestic TTI: -23.18% below its M/A (prior close -27.29%)—Sell signal effective 02/27/2020
International TTI: -24.04% below its M/A (prior close -26.59%)—Sell signal effective 02/26/2020
Disclosure: I am obliged to inform you that I, as well as my advisory clients, own some of the ETFs listed in the above table. Furthermore, they do not represent a specific investment recommendation for you, they merely show which ETFs from the universe I track are falling within the specified guidelines.
Contact Ulli