
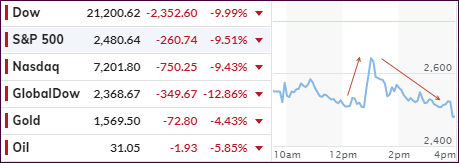
[Chart courtesy of MarketWatch.com]
- Moving the markets
In a few decades, historians will look back at the past 10 years and shake their heads in disbelieve at the insane Fed monetary policies that have kept markets artificially propped up, while “disallowing” any downside moves beyond a certain “acceptable” percentage.
Though many erroneously attribute the current market disaster to the coronavirus, that is incorrect. The virus was merely the pin that pricked the ever-growing bubbles, which would have burst anyway, but we might have pushed the can down the road a little longer.
ZH and others posted these relevant commentaries:
- This bull market will go down in history as the one that nobody believed would last this long. A lot of people have been hurt because their retirement money disappeared…. What brought us to where we are in 2020 is too much hope, sky-high valuations.
- Did I see it coming this far? No. Throughout the past 11 years, the market has had a lot of dips, and always the Federal Reserve came to the rescue…. Right now, the Fed is not enough, central bank action is not enough. There is a pyramid of uncertainty right now.
- Does the Fed really want to have a put every time the market gets nervous? …Coming off all-time highs, does it make sense for The Fed to bail the markets out every single time… creating a trap?
- The Fed has created this dependency and there’s an entire generation of money-managers who … have only seen a one-way street… of course they’re nervous.
- The question is – do you want to feed that hunger? Keep applying that opioid of cheap and abundant money?
- The market is dependent on Fed largesse… and we made it that way…
At this moment, the crash fest goes on with utter abandon causing one analyst to ask:
“Is the market now like an “Oriental Rug Factory” where “Everything Must Go?”
It certainly feels that way now, as many leveraged traders are forced to unwind and sell everything, including safe-haven assets like precious metals, in order to meet margin calls.
Of course, in bear markets we can witness and sharp rebounds of great magnitude, but that does not mean a new bull market is imminent. Case in point was today, when the Fed fired a bazooka by unleashing a $1.5 trillion Rep bailout, which means up to $3 trillion in cumulative repos by the end of the month.
The effect was immediate, as the above chart shows, with the Dow regaining some 1,500 points within minutes. Unfortunately, this was merely a dead cat bounce, and the markets resumed their downward trajectory with utter abandon leaving me pondering as to whether the Fed has finally run out of ammunition.
However, I expect them to drop rates to zero, or below, and directly intervene in the markets, just like the Japanese Central Bank does, by openly buying stocks, bonds and ETFs. We will find out soon.
Yes, the thing that may have been unthinkable 3 weeks ago is upon us. The bear market has arrived with full force and may be hanging around for a while.
Being out of the market and on the sidelines never felt so right.
2. ETFs in the Spotlight
In case you missed the announcement and description of this section, you can again.
It features 10 broadly diversified and sector ETFs from my HighVolume list as posted every Saturday. Furthermore, they are screened for the lowest MaxDD% number meaning they have been showing better resistance to temporary sell offs than all others over the past year.
The below table simply demonstrates the magnitude with which some of the ETFs are fluctuating regarding their positions above or below their respective individual trend lines (%+/-M/A). A break below, represented by a negative number, shows weakness, while a break above, represented by a positive percentage, shows strength.
For hundreds of ETF choices, be sure to reference Thursday’s StatSheet.
For this past domestic “Buy” cycle, which ended on 2/27/2020, here’s how some our candidates have fared:
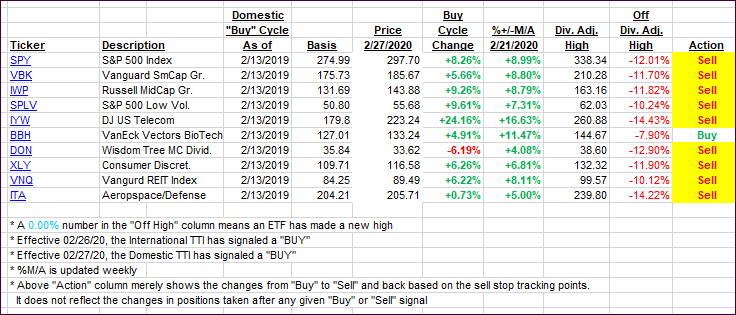
Click image to enlarge
Again, the %+/-M/A column above shows the position of the various ETFs in relation to their respective long-term trend lines, while the trailing sell stops are being tracked in the “Off High” column. The “Action” column will signal a “Sell” once the -8% point has been taken out in the “Off High” column. For more volatile sector ETFs, the trigger point is -10%.
3. Trend Tracking Indexes (TTIs)
Our TTIs absolutely plummeted as the markets took a 10% hit. There is not much to say other than that our TTIs with their accurate timing saved our bacon.
Here’s how we closed 03/12/2020:
Domestic TTI: -23.80% below its M/A (prior close -15.25%)—Sell signal effective 02/27/2020
International TTI: -23.62% below its M/A (prior close -15.18%)—Sell signal effective 02/26/2020
Disclosure: I am obliged to inform you that I, as well as my advisory clients, own some of the ETFs listed in the above table. Furthermore, they do not represent a specific investment recommendation for you, they merely show which ETFs from the universe I track are falling within the specified guidelines.
Contact Ulli