Edging Higher On Mixed Earnings

Ulli Market Commentary Contact

[Chart courtesy of MarketWatch.com]
  1. Moving the markets

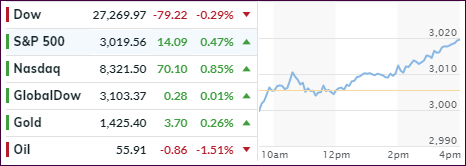
Aimless meandering best describes today’s early part of the session, during which the major indexes, except for the Dow, hovered around their respective unchanged lines. A sudden mid-day pump not only pushed the two indexes into the green but also to a new record close. The Dow was weighed down, as poor profit reports by component members Caterpillar and Boeing kept the index in the red all day long.

The Nasdaq held up surprisingly well, despite the Justice Department launching a broad anti-trust investigation into the big tech companies (FANG names). Depending on the extent, this action could eventually cause this rally to stagger.

On the economic front, we learned that New Home Sales missed expectations (646k vs. 658k) despite a collapse in mortgage rates, which did not bring back an onslaught of buyers. Adding insult to injury, the purchases for March, April and May were all revised lower. However, YoY new-home sales rebounded.

Manufacturing hit the skids again, not just here in the U.S. but also in Europe and Japan, while the domestic service sector beat expectations. As one analyst pointed out, this simply means “we have a two-speed economy with a steady service sector growth masking a deepening downturn in the manufacturing sector.”

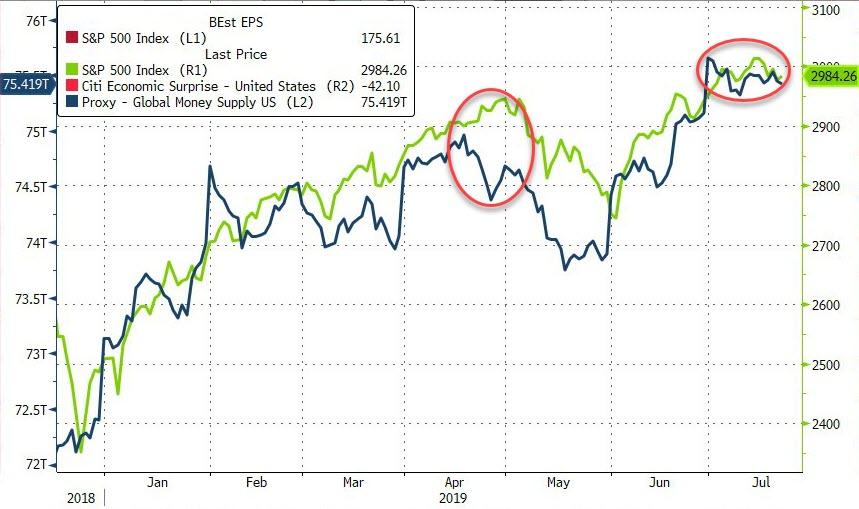
I see two conflicts righty now affecting the markets. One, central banks are about to embark on more easing, yet on the other hand, the slowdown of growth on a global scale, along with some geopolitical factors, is weighing on traders’ minds. Can more central bank intervention really extend this already overextended business cycle?

I guess we’ll have to wait and find out.

Read More

No Market Commentary Today

Ulli Uncategorized Contact

Due to a variety of commitments, I will be out of the office most of the day and will not be able to write the market commentary. Regular posting will resume tomorrow.

Ulli…

Battling For Direction As Earnings Season Heats Up

Ulli Market Commentary Contact

[Chart courtesy of MarketWatch.com]
  1. Moving the markets

It was a session during which the major indexes predominantly hugged their respective unchanged lines without showing much directional preference.

The exception was the Nasdaq, which benefited from strength of big-tech companies, despite the number of declining stocks outnumbering the advancing ones. That means, the drive higher was the result of the more liquid and larger cap companies like Microsoft, Amazon and Apple.

The Dow barely managed to close in the green, while the S&P stayed above its unchanged line all day and closed with a +0.28% gain. Traders are on edge as this week will bring a whirlwind of earnings results.

About one-third of the Dow components will be on deck and some 144 companies of the S&P 500 are due to present their report cards, including media giant Facebook, whose results are eagerly awaited this Wednesday.

Better than expected outcomes could certainly be a driving force to higher prices, but in the end, it’s all about the liquidity, or lack thereof, in the global financial system, as this chart suggests.

Read More

ETFs On The Cutline – Updated Through 07/19/2019

Ulli ETFs on the Cutline Contact

Below, please find the latest High-Volume ETF Cutline report, which shows how far above or below their respective long-term trend lines (39-week SMA) my currently tracked ETFs are positioned.

This report covers the HV ETF Master List from Thursday’s StatSheet and includes 322 High Volume ETFs, defined as those with an average daily volume of more than $5 million, of which currently 272 (last week 278) are hovering in bullish territory. The yellow line separates those ETFs that are positioned above their trend line (%M/A) from those that have dropped below it.

Take a look:                                                                   

The HV ETF Master Cutline Report

In case you are not familiar with some of the terminology used in the reports, please read the Glossary of Terms. If you missed the original post about the Cutline approach, you can read it here.      

ETF Tracker Newsletter For July 19, 2019

Ulli ETF Tracker Contact

ETF Tracker StatSheet          

You can view the latest version here.

WALKING BACK THE TALK

[Chart courtesy of MarketWatch.com]
  1. Moving the markets

Yesterday’s extremely dovish words by the Fed’s mouthpiece Williams seem to have struck some raw nerves, as the Fed tried to walk back the “communications debacle.” It was like putting the toothpaste back in the tube, as William’s viewpoint raised market expectations to an upcoming 0.5% rate cut as opposed to a potential 0.25% reduction.

This kind of head fake caused the NY Fed to subsequently release a statement stating that “President William’s speech on Thursday afternoon was not intended to send a signal  that the Fed might make a large interest rate cut but rather is was ‘an academic speech on 20 years of research.’”

Of course, the markets reacted positively yesterday, but today’s reality check pulled the major indexes off their early session highs and sent them south with all three of them not only closing in the red but also at the lows for the day. Summing it up, the Fed better deliver a 0.25% rate cut, or equities will head south in a big way.

Tensions in the Middle East ratcheted up a notch, as a drone was downed, and an oil tanker was hijacked, which had traders is a sour mood adding to the overall negativity in the marketplace.

While bond yields tumbled for the week, they did spike today, thereby negatively affecting bond prices, as well as low volatility ETFs, such as SPLV.  

Benefiting from all this turmoil was the long-forgotten metal, namely silver. It soared over 6% for the week and is back above $16. This was silver’s biggest weekly gain since July 2016, and it improved its ratio with gold considerably, as the chart shows.

While all eyes are on the Fed, they will not issue their verdict on interest rates until July 31, which means we have another 1.5 weeks to put up with the seemingly endless jawboning as to why they should or should not pull the trigger.

Read More

Weekly StatSheet For The ETF Tracker Newsletter – Updated Through 07/18/2019

Ulli ETF StatSheet Contact

ETF Data updated through Thursday, July 18, 2019

Methodology/Use of this StatSheet:

1. From the universe of over 1,800 ETFs, I have selected only those with a trading volume of over $5 million per day (HV ETFs), so that liquidity and a small bid/ask spread are assured.

2. Trend Tracking Indexes (TTIs)

Buy or Sell decisions for Domestic and International ETFs (section 1 and 2), are made based on the respective TTI and its position either above or below its long-term M/A (Moving Average). A crossing of the trend line from below accompanied by some staying power above constitutes a “Buy” signal. Conversely, a clear break below the line constitutes a “Sell” signal. Additionally, I use a 7.5% trailing stop loss on all positions in these categories to control downside risk.

3. All other investment arenas do not have a TTI and should be traded based on  the position of the individual ETF relative to its own respective trend line (%M/A). That’s why those signals are referred to as a “Selective Buy.” In other words, if an ETF crosses its own trendline to the upside, a “Buy” signal is generated. Since these areas tend to be more volatile, I recommend a wider trailing sell stop of 7.5% -10% depending on your risk tolerance.

If you are unfamiliar with some of the terminology, please see Glossary of Terms and new subscriber information in section 9.     

1. DOMESTIC EQUITY ETFs: BUY — since 02/13/2019

Click on chart to enlarge

Our main directional indicator, the Domestic Trend Tracking Index (TTI-green line in the above chart) is now positioned above its long-term trend line (red) by +7.44% after having generated a new Domestic “Buy” signal effective 2/13/19 as posted.

Read More