The stimulus effort by the People’s Bank of China to combat
the economic impact of the coronavirus set a positive tone for world markets early
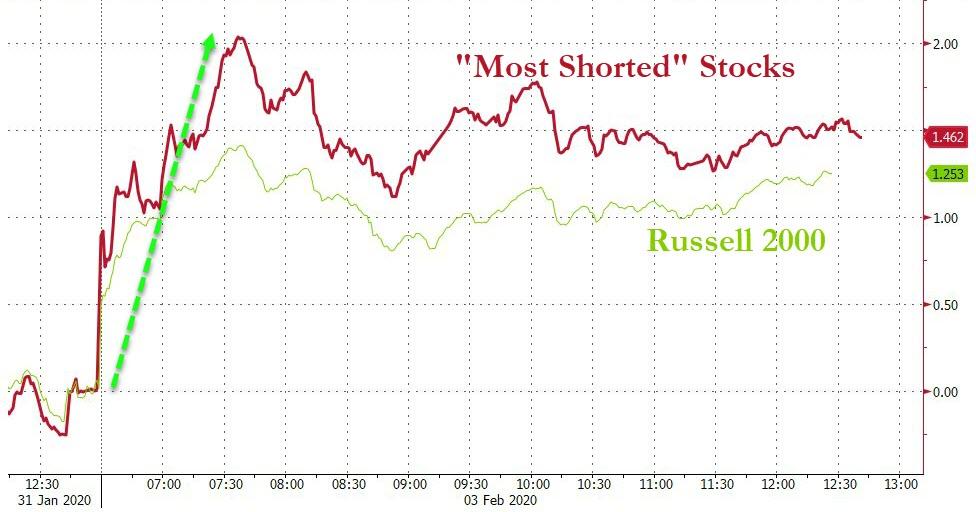
on, with the domestic ones opening sharply higher aided by another short
squeeze. It was simply a matter of investors gaining confidence in that central
bankers will take measures to stabilize economies, which in turn supports a move
back into risk assets again.
Politics supported equities today as Trump is expected to
be cleared of impeachment charges on Wednesday, while the State of the Union
address tonight is anticipated to be one of positives, thereby further supporting
bullish sentiment.
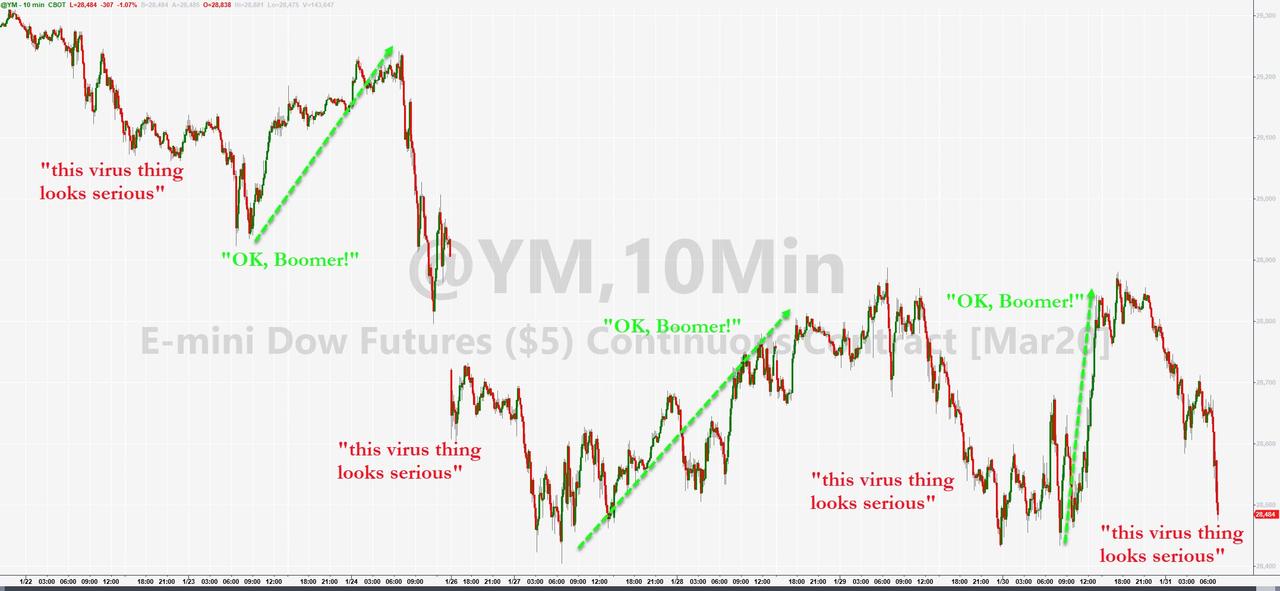
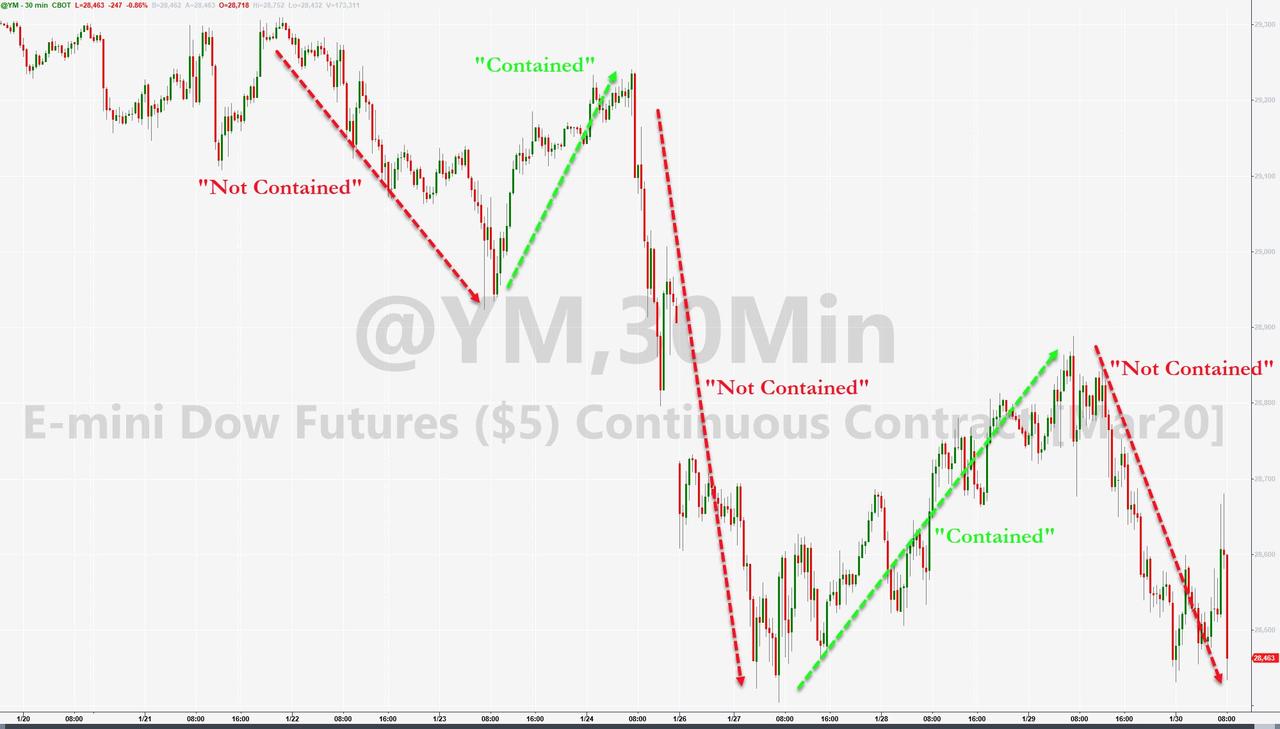
Despite the coronavirus being far from contained, traders
have simply reacted in an upbeat manner based on nothing more than efforts by
the Chinese to limit the spread and the injection of funds to stem any economic
fallout.
I think this debacle is far from being over, but right
now, we are enjoying the rebound.
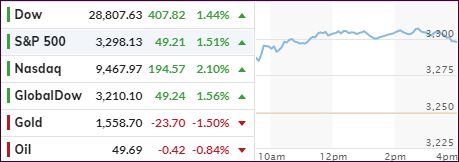
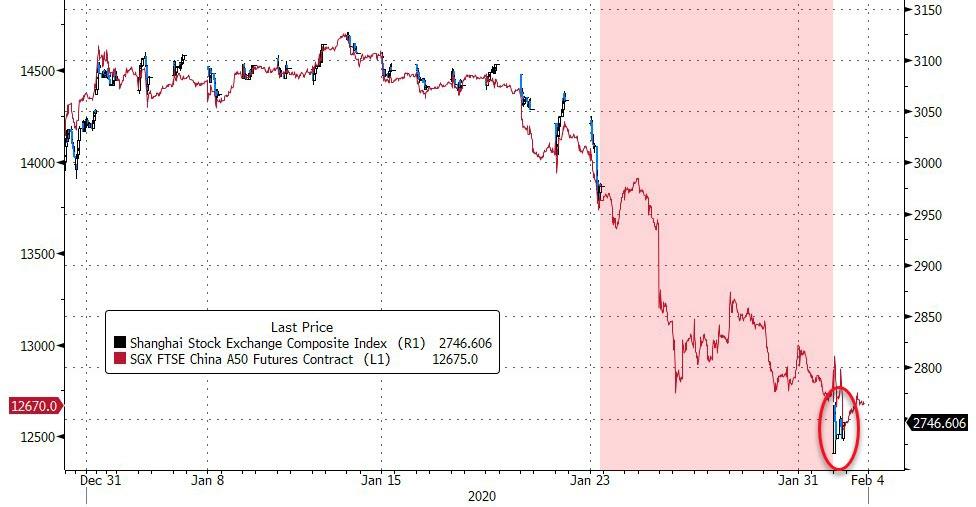
After Friday’s drubbing, and in view of China’s stock
market getting clobbered
at the tune of some -8%, domestic equities jumped right after the opening bell.
While the latter part of the session was flat, the major indexes made up some
lost ground in part thanks to optimism that the coronavirus will be contained.
Helping the recovery were encouraging data from the manufacturing
sector, whose PMI index rose to a six-month high of 50.9% in January against
expectations of 48.5%. That is significant in that any reading below 50%
indicates contraction while any reading above it shows expansion.
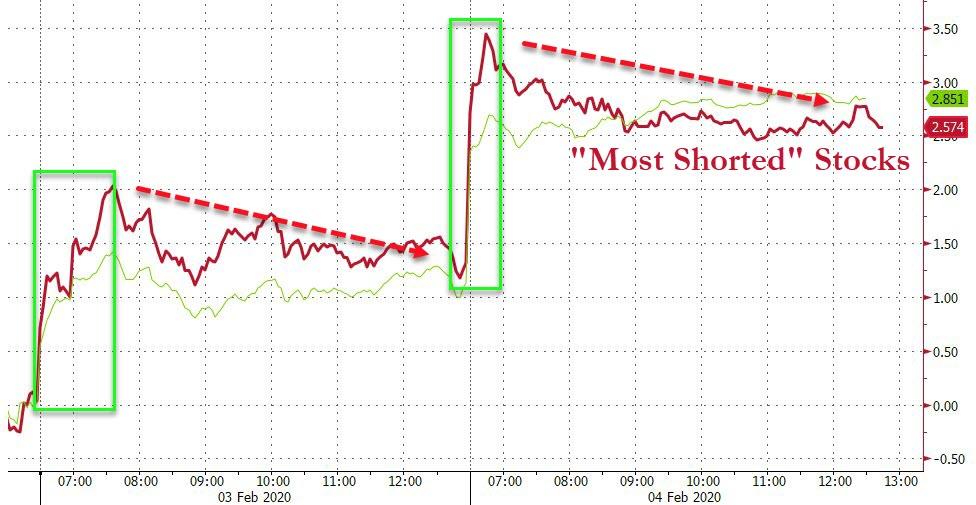
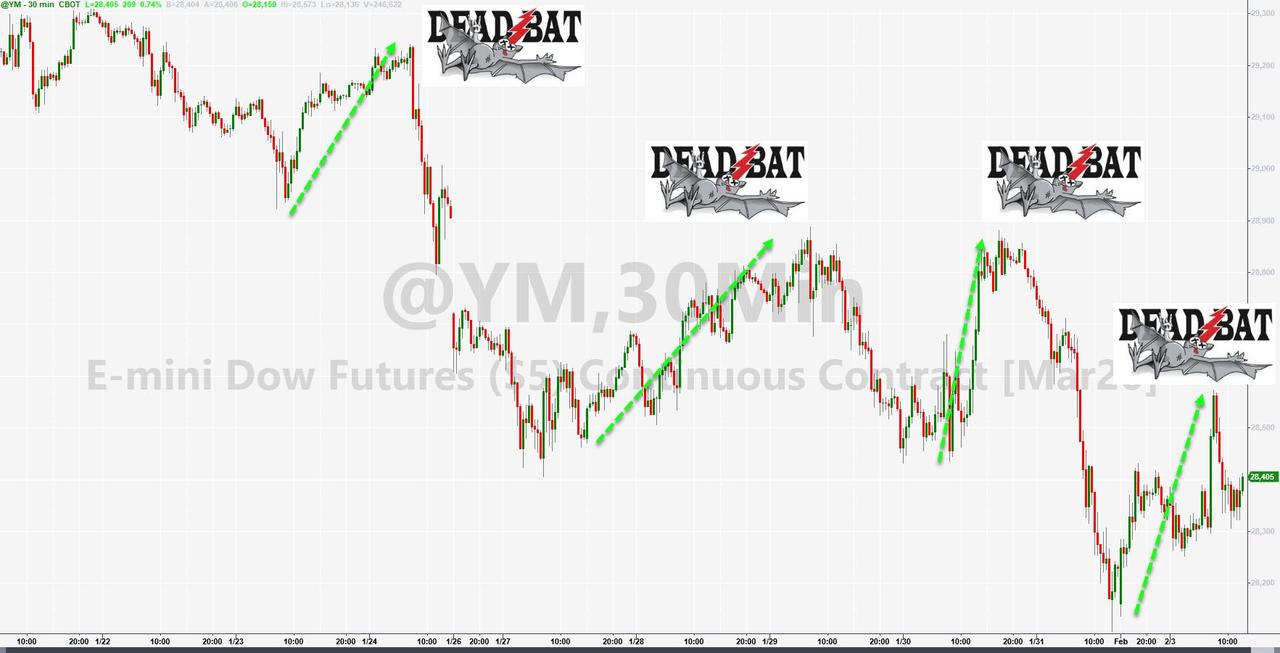
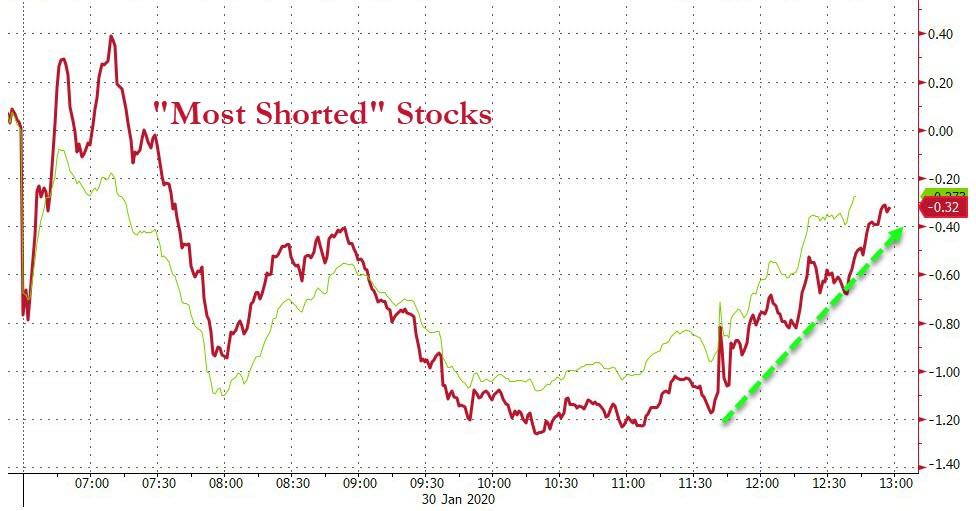
Nevertheless, the entire rebound was about nothing, causing
ZH to describe today’s action as simply another “dead-bat-bounce,” as this
chart demonstrates. However, an early short
squeeze helped to get the bullish momentum going.
Concerns continue to linger about the Chinese stock market,
which not only dropped precipitously but did so despite a ban on short selling.
Trading was halted for hundreds of companies, after their prices dropped 10%, which
triggered the mandatory hold. It appears that there is more fallout to come.
All that upheaval happened despite the POBC (Peoples Bank
of China) announcing a $174 billion injection into their economic system to
stem the downturn. That is to be followed by other stabilization measures.
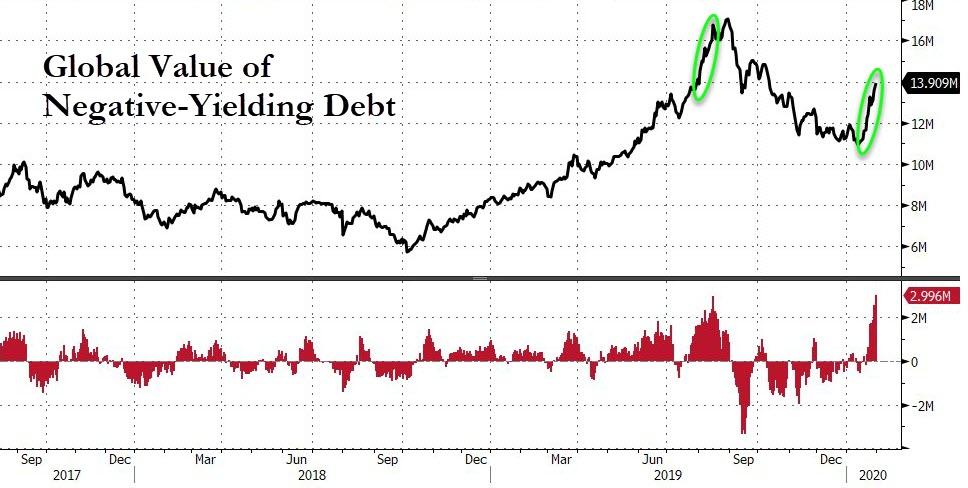
Worldwide, negative yielding debt shot up by another $3
trillion in the last 12 days, according to this
chart by Bloomberg. I think it’s just a matter of time until U.S.
treasuries follow that trend.
Below, please find the latest High-Volume ETF Cutline
report, which shows how far above or below their respective long-term trend
lines (39-week SMA) my currently tracked ETFs are positioned.
This report covers the HV ETF Master List from Thursday’s
StatSheet and includes 322 High Volume ETFs, defined as those with an average
daily volume of more than $5 million, of which currently 248 (last week 279)
are hovering in bullish territory. The yellow line separates those ETFs that
are positioned above their trend line (%M/A) from those that have dropped below
it.
In case you are not familiar
with some of the terminology used in the reports, please read the Glossary of Terms.
If you missed the original
post about the Cutline approach, you can read it here.
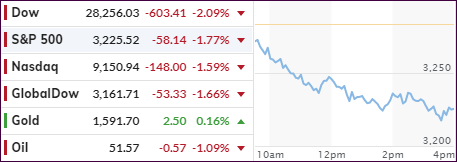
Even
Amazon’s strong quarterly results, and its subsequent 9% jump in stock price,
could not stem the slide, as the ongoing coronavirus epidemic continued full
force, with travel and trade disruptions now becoming a more real threat to
economic growth prospects.
Yesterday’s
rebound of the indexes now appears to have been a dead-cat-bounce,
as a sea of red numbers dominated computer screens throughout the world.
Beijing so far has reported over 9,600 cases of the virus with a death toll of
213. These are only the official numbers, and, by today’s market reaction, it
appears that more bad news is expected over the weekend.
Whenever
markets are subjected to the unknown, pullbacks are the usual reactions,
especially when considering the relentless levitation of the past few months. At
the same time, some analysts are considering this to be “a full valuation”
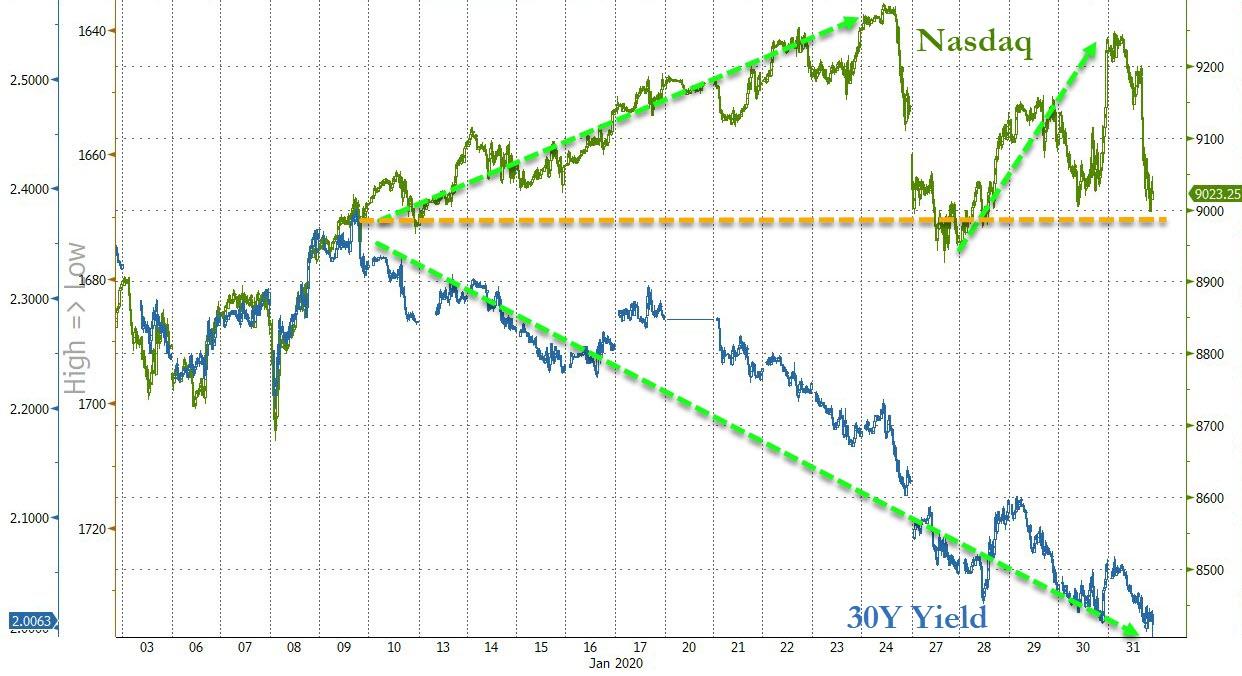
market, which can contribute to corrections as well, especially when the bond
market continues to show the kind of decoupling I posted about yesterday.
Then
the CDC (Center of Disease Control) held another press conference during which
it reiterated, several times, that the risk to the public from the coronavirus is
low, but they forgot to mention that the risk to current market levels is high.
All
eyes are now on China, whose markets will re-open on Monday after the weeklong Lunar
Holiday closure. In the meantime, entire Chinese cities and factory hubs are on
lockdown with some 50 million people being confined to their homes.
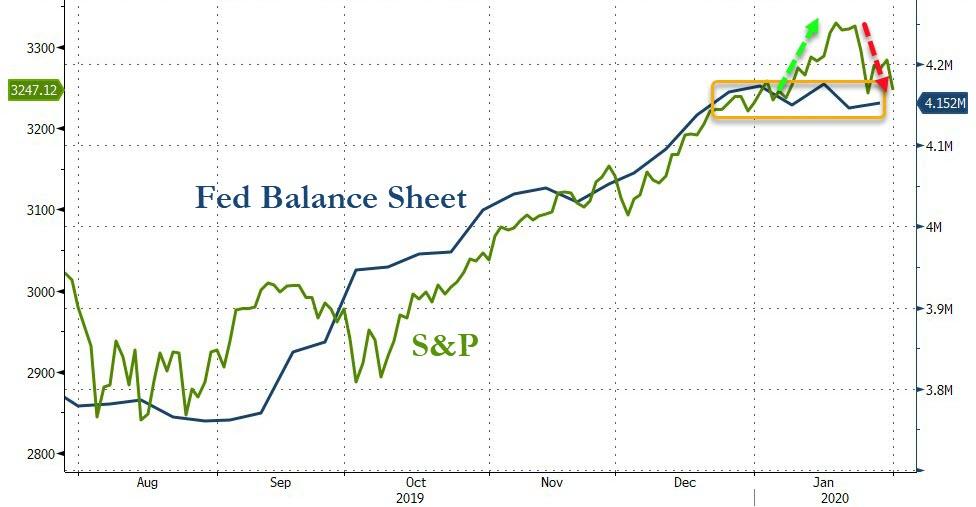
One
look at the big picture, namely the driver for this bull market, also known as
the Fed’s balance sheet, we see a different reason for this sell-off emerge, which
is the lack of expansion of this very balance sheet, as this
chart makes abundantly clear.
In
the absence of this balance sheet picking up some upside momentum, and the
coronavirus being contained, we could potentially see this bull market come to
a screeching halt.
ETF Data
updated through Thursday, January 30, 2020
Methodology/Use of this StatSheet:
1. From the universe of over 1,800 ETFs, I have selected only those with a
trading volume of over $5 million per day (HV ETFs), so that liquidity and a
small bid/ask spread are assured.
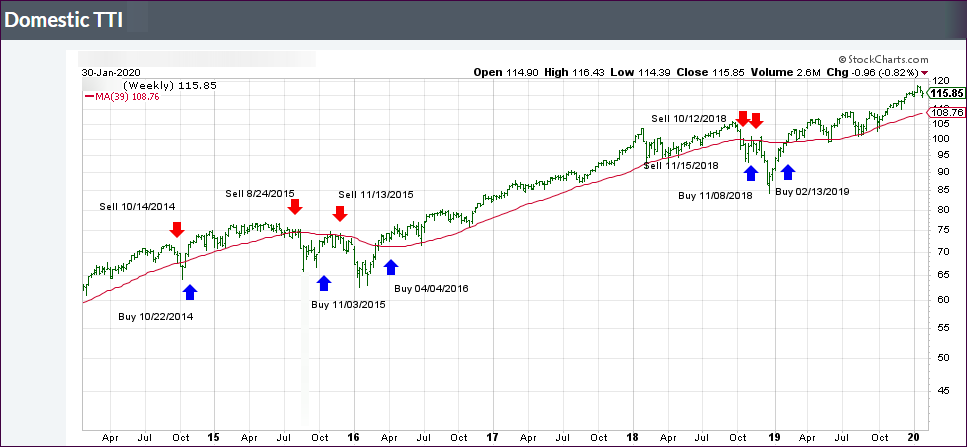
2. Trend Tracking Indexes (TTIs)
Buy or Sell decisions for Domestic and International ETFs (section 1 and
2), are made based on the respective TTI and its position either above or below
its long-term M/A (Moving Average). A crossing of the trend line from below
accompanied by some staying power above constitutes a “Buy” signal. Conversely,
a clear break below the line constitutes a “Sell” signal. Additionally, I use a
7.5% trailing stop loss on all positions in these categories to control
downside risk.
3. All other investment arenas do not have a TTI and should be traded
based on the position of the individual
ETF relative to its own respective trend line (%M/A). That’s why those signals
are referred to as a “Selective Buy.” In other words, if an ETF crosses its own
trendline to the upside, a “Buy” signal is generated. Since these areas tend to
be more volatile, I recommend a wider trailing sell stop of 7.5% -10% depending
on your risk tolerance.
If you are unfamiliar with some of the terminology, please see Glossary of Termsand new subscriber information in section 9.
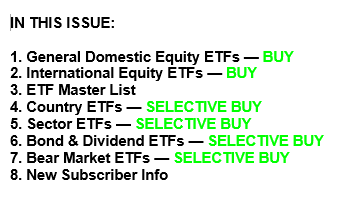
1. DOMESTIC EQUITY ETFs: BUY
— since 02/13/2019
Click on chart to enlarge
Our main directional indicator, the Domestic Trend Tracking Index (TTI-green line in the above chart) is now positioned above its long-term trend line (red) by +6.74% after having generated a new Domestic “Buy” signal effective 2/13/19 as posted.
Right after the opening bell, the markets headed south
following the global negative sentiment caused by a sell-off in Asia, as
coronavirus issues again fanned fears of slowing economic growth worldwide.
Concerns about the epidemic’s impact first overpowered
upbeat earnings news from Microsoft and Tesla, with airline stocks falling due
to the travel disruptions, as the virus spread. Chinese news outlets reported
of 7,700 infections with at least 170 deaths.
China’s stock markets will remain closed till next
Monday, but concerns are increasing that those markets will head south as
investors there will have to catch up with the reality of the virus and its
impact.
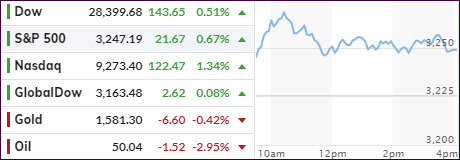
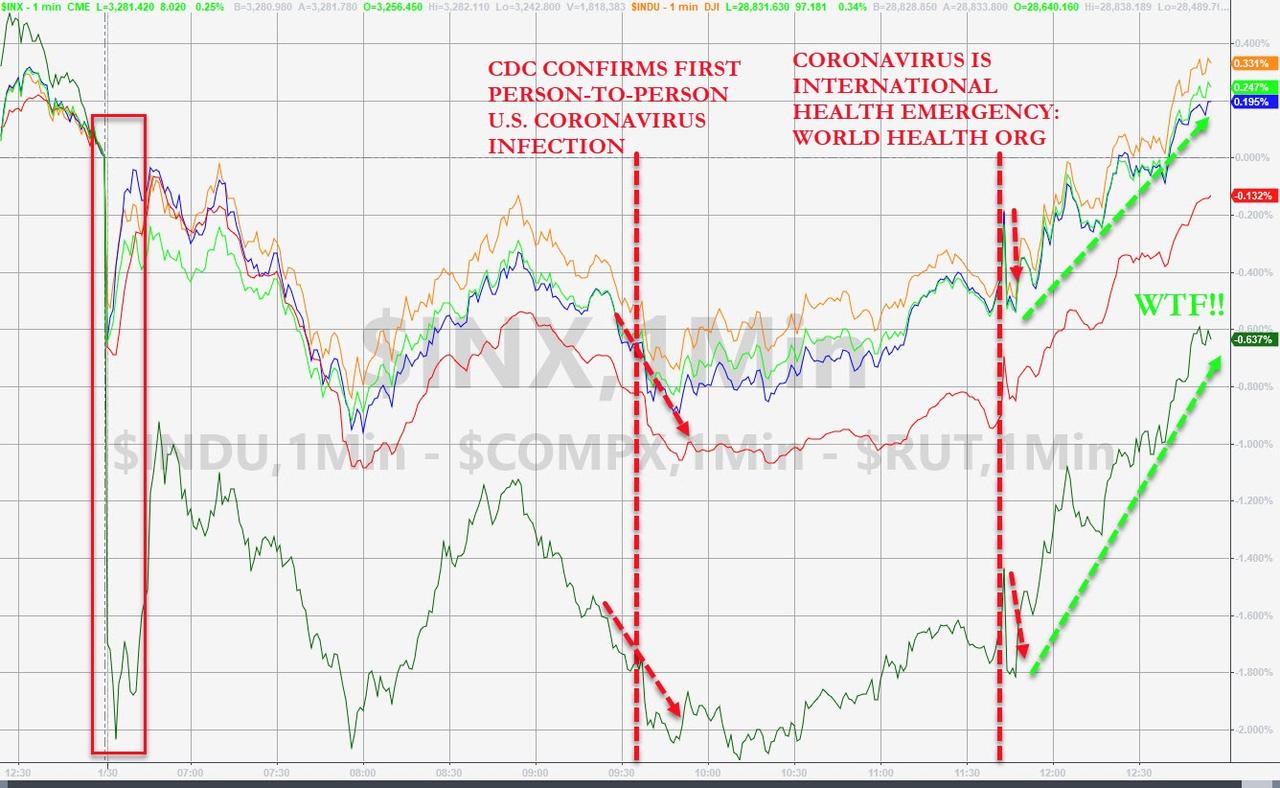
The WHO (World Health Organization) finally named the
virus outbreak, which originated in China, a “public health emergency of
international concern.” That kept downward pressure on stocks, although they
managed to come off their lows of the session, rebounded in the last hour and
squeezed out an unexpected
green close.
As we’ve seen many times in the past, a short-squeeze
provided the ammo for the last hour ramp, which made sure that, with one trading
day to go, the Dow is back in the green for the year. We’ll find out tomorrow, if
it closes the month on a positive note.
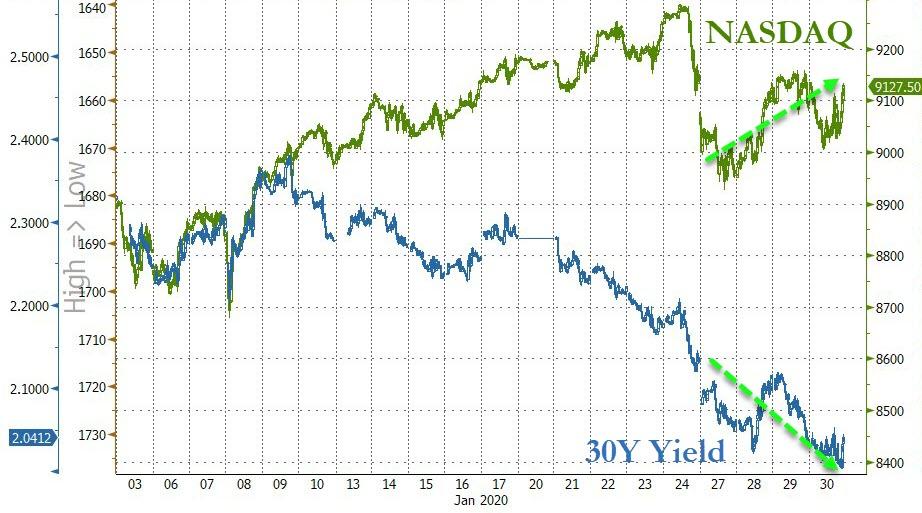
In the meantime, the decoupling
between stocks and bond yields continued unabated.
