
- Moving the markets
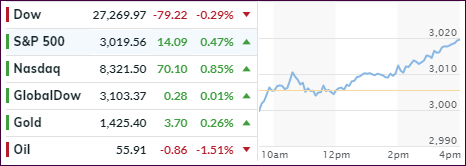
Aimless meandering best describes today’s early part of the session, during which the major indexes, except for the Dow, hovered around their respective unchanged lines. A sudden mid-day pump not only pushed the two indexes into the green but also to a new record close. The Dow was weighed down, as poor profit reports by component members Caterpillar and Boeing kept the index in the red all day long.
The Nasdaq held up surprisingly well, despite the Justice Department launching a broad anti-trust investigation into the big tech companies (FANG names). Depending on the extent, this action could eventually cause this rally to stagger.
On the economic front, we learned that New Home Sales missed expectations (646k vs. 658k) despite a collapse in mortgage rates, which did not bring back an onslaught of buyers. Adding insult to injury, the purchases for March, April and May were all revised lower. However, YoY new-home sales rebounded.
Manufacturing hit the skids again, not just here in the U.S. but also in Europe and Japan, while the domestic service sector beat expectations. As one analyst pointed out, this simply means “we have a two-speed economy with a steady service sector growth masking a deepening downturn in the manufacturing sector.”
I see two conflicts righty now affecting the markets. One, central banks are about to embark on more easing, yet on the other hand, the slowdown of growth on a global scale, along with some geopolitical factors, is weighing on traders’ minds. Can more central bank intervention really extend this already overextended business cycle?
I guess we’ll have to wait and find out.
2. ETFs in the Spotlight
In case you missed the announcement and description of this section, you can read it here again.
It features 10 broadly diversified and sector ETFs from my HighVolume list as posted every Saturday. Furthermore, they are screened for the lowest MaxDD% number meaning they have been showing better resistance to temporary sell offs than all others over the past year.
The below table simply demonstrates the magnitude with which some of the ETFs are fluctuating regarding their positions above or below their respective individual trend lines (%+/-M/A). A break below, represented by a negative number, shows weakness, while a break above, represented by a positive percentage, shows strength.
For hundreds of ETF choices, be sure to reference Thursday’s StatSheet.
For this current domestic “Buy” cycle, here’s how some our candidates have fared:
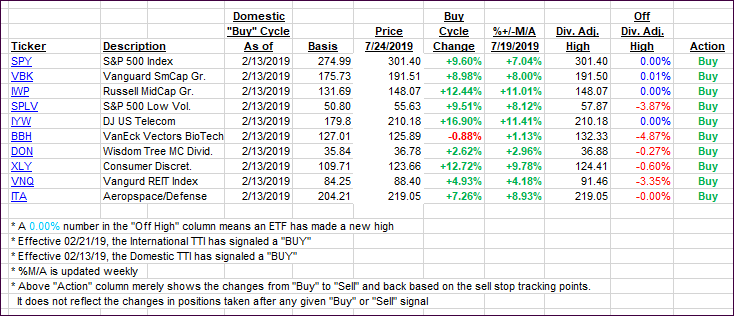
Again, the %+/-M/A column above shows the position of the various ETFs in relation to their respective long-term trend lines, while the trailing sell stops are being tracked in the “Off High” column. The “Action” column will signal a “Sell” once the -8% point has been taken out in the “Off High” column. For more volatile sector ETFs, the trigger point is -10%.
3. Trend Tracking Indexes (TTIs)
Our Trend Tracking Indexes (TTIs) were mixed with the Domestic one jumping while the International trod water.
Here’s how we closed 07/24/2019:
Domestic TTI: +8.41% above its M/A (last close +7.68%)—Buy signal effective 02/13/2019
International TTI: +4.84% above its M/A (last close +4.86%)—Buy signal effective 06/19/2019
Disclosure: I am obliged to inform you that I, as well as my advisory clients, own some of the ETFs listed in the above table. Furthermore, they do not represent a specific investment recommendation for you, they merely show which ETFs from the universe I track are falling within the specified guidelines.
Contact Ulli