
- Moving the markets
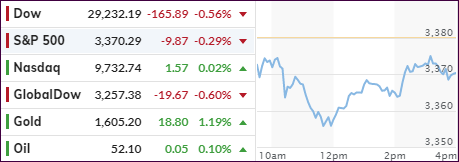
Powerhouse Apple Inc. pulled the plug on Wall Street this morning, after announcing that its second quarter results may be impacted by the virus outbreak in China.
This in turn stoked fears again that any potential interruptions of supply chains will have far-reaching consequences not just for worldwide economies but also the financial markets.
Apple clearly stated that its monetary guidance for the second quarter will not be met, because its suppliers’ manufacturing has been affected, but discussions with health experts and suppliers continue full force.
Sure, Wall Street expected some of these announcements, but the magnitude of it came as a surprise. However, financial markets don’t like surprises, hence the sell-off today. In other words, the always optimistic traders, who had shaken off concerns about the disease, are now facing a dose of reality.
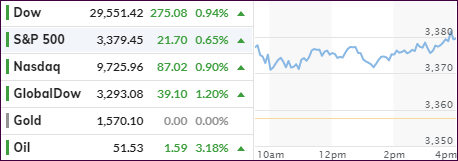
While the mid-day recovery pulled the indexes off their worst levels, only the Nasdaq managed to gather enough steam to close in the green.
Still, it’s amazing when the world’s largest company, Apple, issues a warning on a holiday about the unknown fallout from the coronavirus, and the markets barely seem to notice, as the mid-session drop caused dip buyers to step in to “save” the bullish theme.
Read More