
- Moving the markets
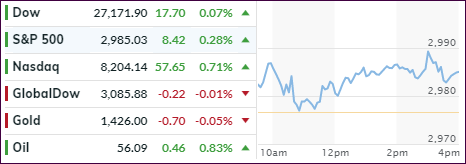
It was a session during which the major indexes predominantly hugged their respective unchanged lines without showing much directional preference.
The exception was the Nasdaq, which benefited from strength of big-tech companies, despite the number of declining stocks outnumbering the advancing ones. That means, the drive higher was the result of the more liquid and larger cap companies like Microsoft, Amazon and Apple.
The Dow barely managed to close in the green, while the S&P stayed above its unchanged line all day and closed with a +0.28% gain. Traders are on edge as this week will bring a whirlwind of earnings results.
About one-third of the Dow components will be on deck and some 144 companies of the S&P 500 are due to present their report cards, including media giant Facebook, whose results are eagerly awaited this Wednesday.
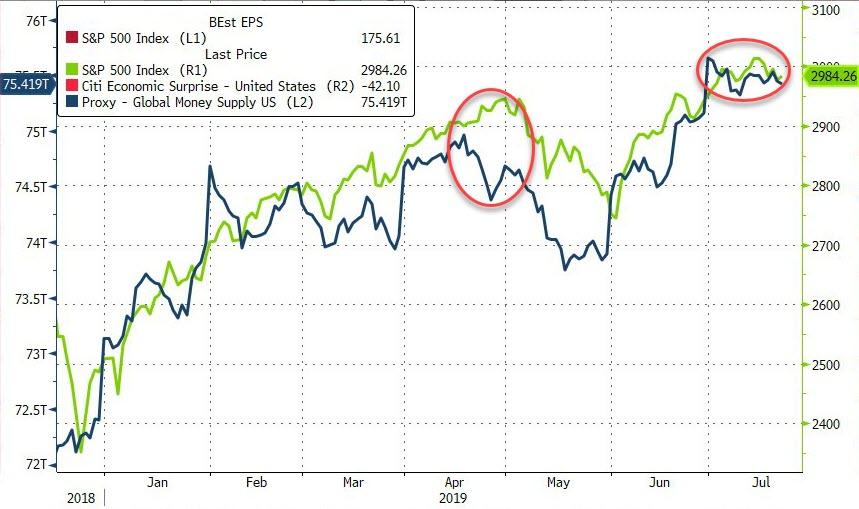
Better than expected outcomes could certainly be a driving force to higher prices, but in the end, it’s all about the liquidity, or lack thereof, in the global financial system, as this chart suggests.
2. ETFs in the Spotlight
In case you missed the announcement and description of this section, you can read it here again.
It features 10 broadly diversified and sector ETFs from my HighVolume list as posted every Saturday. Furthermore, they are screened for the lowest MaxDD% number meaning they have been showing better resistance to temporary sell offs than all others over the past year.
The below table simply demonstrates the magnitude with which some of the ETFs are fluctuating regarding their positions above or below their respective individual trend lines (%+/-M/A). A break below, represented by a negative number, shows weakness, while a break above, represented by a positive percentage, shows strength.
For hundreds of ETF choices, be sure to reference Thursday’s StatSheet.
For this current domestic “Buy” cycle, here’s how some our candidates have fared:
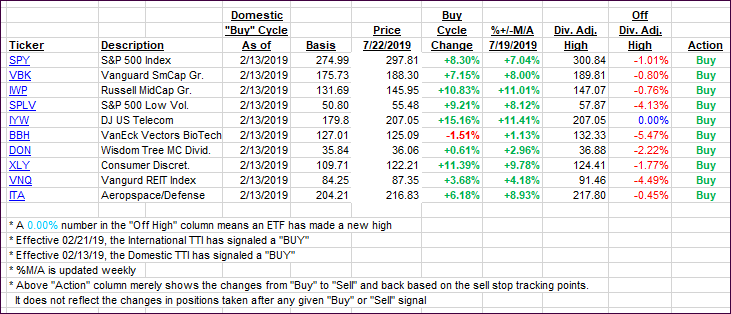
Again, the %+/-M/A column above shows the position of the various ETFs in relation to their respective long-term trend lines, while the trailing sell stops are being tracked in the “Off High” column. The “Action” column will signal a “Sell” once the -8% point has been taken out in the “Off High” column. For more volatile sector ETFs, the trigger point is -10%.
3. Trend Tracking Indexes (TTIs)
Our Trend Tracking Indexes (TTIs) barely changed as substantial market moves in either direction were conspicuously absent.
Here’s how we closed 07/22/2019:
Domestic TTI: +6.76% above its M/A (last close +6.74%)—Buy signal effective 02/13/2019
International TTI: +4.25% above its M/A (last close +4.24%)—Buy signal effective 06/19/2019
Disclosure: I am obliged to inform you that I, as well as my advisory clients, own some of the ETFs listed in the above table. Furthermore, they do not represent a specific investment recommendation for you, they merely show which ETFs from the universe I track are falling within the specified guidelines.
Contact Ulli