ETF Tracker Newsletter For March 20, 2020

Ulli ETF Tracker Contact

ETF Tracker StatSheet          

You can view the latest version here.

CRASHING INTO THE WEEKEND

[Chart courtesy of MarketWatch.com]
  1. Moving the markets

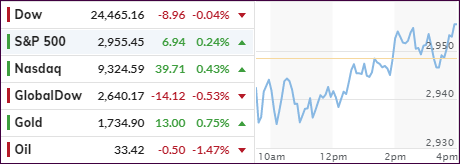
Despite an early bounce along the green side of the unchanged line, reality set in, supported by the always unpredictable quad options expirations day, sending the markets reeling—again.

The major indexes were hammered, with the S&P 500 getting skunked by -15%—for the week! Not helping matters late in the day was the fact that a death-cross in the Dow had occurred, meaning its 50-day moving average had dropped below its 200-day M/A, which can be a sign of more weakness ahead.

Of course, some clueless analysts were quick to point out that the last death cross appeared three days before the Christmas Eve 2018 bottom. So, what difference does that make? All the gains from that point forward have now been given back and then some, which is a clear representation of the buy-and-hold idiocy.  

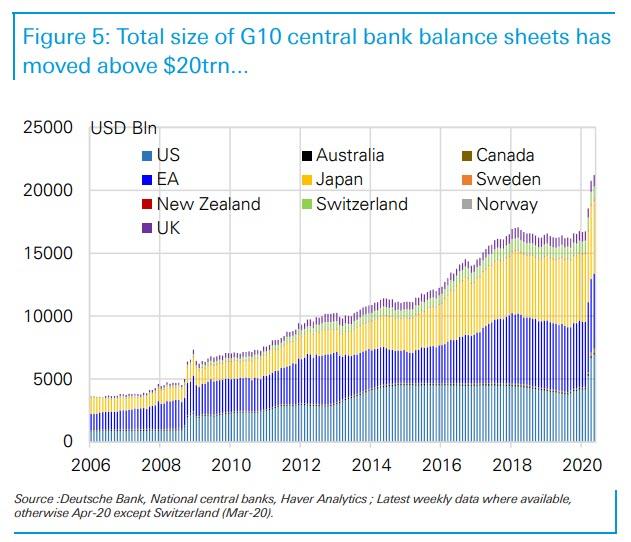
ZH points to the fact that today was a historic one. The Fed bought a record $107 billion in securities today alone, as its balance sheet exploded some 50% in the last six months. It becomes clearer by the day that the Fed’s scramble to stabilize the Treasury market is not working.

As I said before, there is some big player (to be named later), like a bank or Hedge fund, that got caught on the wrong side of a severely leveraged trade and needs to be bailed out. Hence the monetization of various securities, including now the Muni bond market. Something appears to be broken beyond repair, and I am sure we will find out soon what it is.

ZH added more color:

This was the worst week since Lehman (and worst 4 weeks since Nov 1929) for The Dow Jones Industrial Average…(Dow was down 18% during the Lehman week and 17.35% this week), despite The Fed gushing a stunning $307 billion into the markets – almost double its previous biggest liquidity injection (in March 2009)…

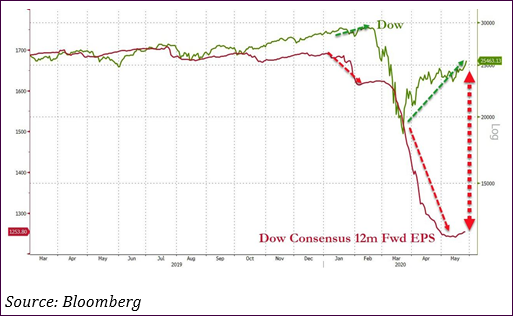
And here’s Bloomberg’s updated chart showing where we might be going, and that is towards the 1,700 level on the S&P 500. And longer term, we may even see history repeat itself.

In the meantime, enjoy the popcorn while watching this movie from the sidelines.

Read More

Weekly StatSheet For The ETF Tracker Newsletter – Updated Through 03/19/2020

Ulli ETF StatSheet Contact

ETF Data updated through Thursday, March 19, 2020

Methodology/Use of this StatSheet:

1. From the universe of over 1,800 ETFs, I have selected only those with a trading volume of over $5 million per day (HV ETFs), so that liquidity and a small bid/ask spread are assured.

2. Trend Tracking Indexes (TTIs)

Buy or Sell decisions for Domestic and International ETFs (section 1 and 2), are made based on the respective TTI and its position either above or below its long-term M/A (Moving Average). A crossing of the trend line from below accompanied by some staying power above constitutes a “Buy” signal. Conversely, a clear break below the line constitutes a “Sell” signal. Additionally, I use a 7.5% trailing stop loss on all positions in these categories to control downside risk.

3. All other investment arenas do not have a TTI and should be traded based on  the position of the individual ETF relative to its own respective trend line (%M/A). That’s why those signals are referred to as a “Selective Buy.” In other words, if an ETF crosses its own trendline to the upside, a “Buy” signal is generated. Since these areas tend to be more volatile, I recommend a wider trailing sell stop of 7.5% -10% depending on your risk tolerance.

If you are unfamiliar with some of the terminology, please see Glossary of Terms and new subscriber information in section 9.     

1. DOMESTIC EQUITY ETFs: SELL — since 02/27/2020
Click on chart to enlarge

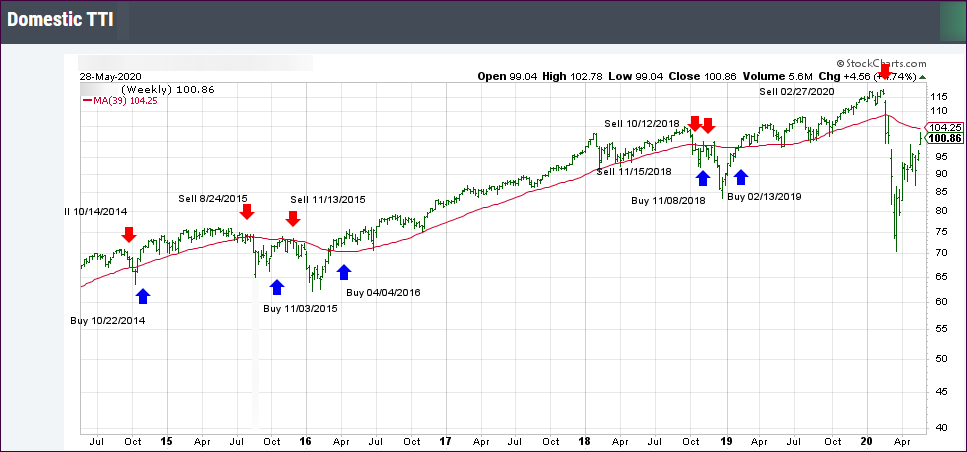
Our main directional indicator, the Domestic Trend Tracking Index (TTI-green line in the above chart) is now positioned below its long-term trend line (red) by -27.99% after having generated a new Domestic “Sell” signal effective 2/27/20 as posted.

Read More
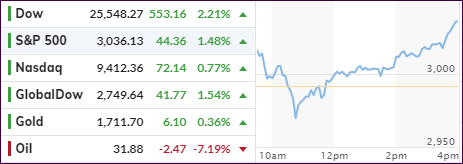
Limping Higher

Ulli Market Commentary Contact

[Chart courtesy of MarketWatch.com]
  1. Moving the markets

Last night, the futures fluctuated wildly with that theme continuing throughout today’s trading day with the major indexes swinging around their respective moving averages.

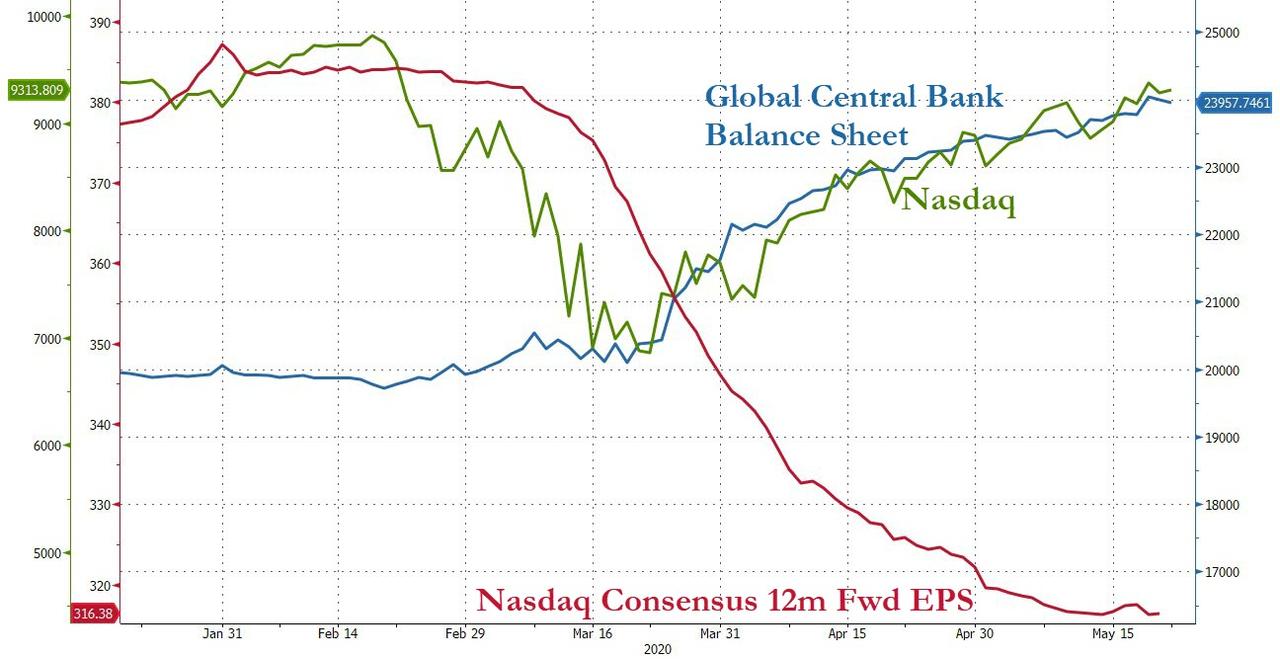
It appears that traders tried to figure out the possible consequences of the all-out “kitchen sink” approach by the global central banks. It’s hard to keep track of all their efforts to prop up the markets, but ZH managed to compile this summary:

  1. Fed announced a new emergency program (MMLF) to aid money markets
  2. ECB “no limits” bazooka (“Pandemic Purchase Program w/ $820B of QE)
  3. RBA 25bps cut to ELB, introduces QE and targeted YCC
  4. Japan discussing $276B packed including “cash payouts” to households
  5. S Korea new $40B package
  6. Brazilian 50bps rate cut
  7. US Senate passes 2nd stimulus bill and negotiating the 3rd ($1.3T)
  8. Fresh headlines from Bloomberg *GERMANY MAY AUTHORIZE EMERGENCY DEBT AS SOON AS NEXT WEEK
  9. BOE emergency rate cut to 0.1% and GBP200BN QE expansion

The most recognized one was the ECB’s launch of Bazooka #2, but we’ll have to wait and see if this thing will really produce the desired result, or simply resemble a squirt from a water pistol.

The Fed, on the other hand, has now boosted its daily QE by 66% overnight to a record $75 billion, and that is in ONE day. For comparison, in the “good old days,” QE was less than that in ONE Month.

What this tells me is that the financial plumbing is showing some serious leaks, which means some big players, be it hedge funds or banks, are likely caught on the wrong side of a trade and are in dire straits of a bailout. I am sure we will find out soon who these suspects are.

Still, we remain in a bear market for the foreseeable future. While no one knows where the eventual bottom will be, a temporary stopping point in this slide could be once the S&P’s price matches up with reality, AKA US corporate profits, as Bloomberg presents in this chart. For the S&P, that would mean a level of around 1,700, which would be down another 30% from current prices. Ouch!

Looking at the big picture, not only have global markets seen $25 trillion of monopoly money, AKA “paper” wealth, erased over the past 4 weeks, the bear has also annihilated all gains from the December 2018 crash; that is for those in the buy-and-hold community.

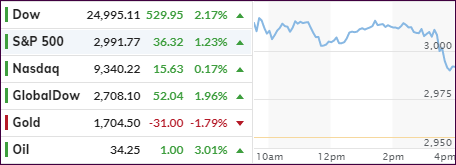
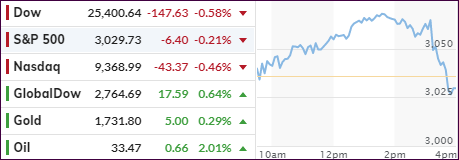
In the meantime, the major indexes managed to eke out a small gain with the Nasdaq faring the best with +2.30%, but for the week, the Dow is the worst performer: Down by -13%.

Read More

Equities Get Crushed—Dow Loses The 20,000 Level

Ulli Market Commentary Contact

[Chart courtesy of MarketWatch.com]
  1. Moving the markets

So much for yesterday’s rebound of “hope,” which got annihilated, as the major indexes took another step down. At one point, the Dow even lost its 19k level, while the S&P dropped below 2.3k, but both were pushed back up thanks to a bounce off their lows during the past 30 minutes.

Those buy-and-holders, which were hoping for the bond portion of their portfolios to bail them out, were disappointed again, as yields rose, with the 10-year being up almost 11 basis points to 1.19%, thereby exerting a double whammy loss on portfolios still exposed to this insanity.  

It’s no surprise that the cause of this upheaval is the fallout from the coronavirus, as nations are shutting down, major corporations and businesses struggling and looking for bailouts, while the banking sector is about to experience some major pain, and possible failures, as above businesses may not be able to survive a sharp drop in revenue, thereby increasing the possibility of defaults. Or, better said, bank failures may be on the horizon.

Of course, the underlying problems are the same we saw in 2008, as nothing has been fixed, with ZH summing up the problem like this:

And it may come as a shock to some, but ever since the financial crisis nothing has been actually fixed, and instead the Fed stepped in at every market stress event to inject more liquidity, aiding the issuance of even more debt, and kicking the can while helping mask the symptoms of the crisis, only made the underlying financial instability even more acute.

Meanwhile, conventional wisdom that the US banking system was rendered more stable now are dead wrong, with the public and countless financial professionals fooled by the nearly two trillion in excess reserves (we all saw what happened when this number dropped to a precarious “low” of “only” $1.3 trillion in September of 2019) injected by the Fed in recent years. All this liquidity upon liquidity has only made the system that much more reliant on the Fed’s constant bailouts and liquidity injections.

With market panic accelerating, and as I pointed out above, ZH confirmed that today was the worst day ever for a combined equity/bond portfolio, down -9.87%, as shown in Bloomberg’s chart.

The carnage may have a long way to go, so as trend trackers, we feel privileged to enjoy a front row seat on the sidelines.

Read More

Stimulus Hopes Pull Stocks Out Of The Doldrums

Ulli Market Commentary Contact

[Chart courtesy of MarketWatch.com]
  1. Moving the markets

Equities managed a nice bounce today powered higher by news that the Trump administration asked for a $1 trillion fiscal stimulus package to mitigate the fallout effects from the coronavirus. News that the Fed moved to support the commercial paper market via providing short-term funding needs, also gave an assist and elevated sentiment.

After getting slaughtered yesterday, the major indexes staged a nice rebound wiping out some of yesterday’s losses yet being far away from establishing a new bullish trend.

Some of the measures the government is evaluating to help combat the effects of the virus includes deferral of tax payments, sending checks directly to the populace, also known as helicopter money, and keeping the financial markets open and functioning.

Whether all these efforts will have the desired effect remains to be seen, especially on the Fed’s part, where despite intervention, banking liquidity worsened. At the same time, the 10-year yield spiked back above 1%, up a substantial 30bps from the lows of the day. Something still does not make sense in the overnight lending market.  

All this has affected equities, where we have witnessed 3%+ moves in the S&P 500 during 13 of the past 22 trading days, approaching the October 2008 experience, according to ZH. Systemic risk levels continue to soar, as Bloomberg points out here.

Safety is number one in my book where, during these trying times, the return of our capital ranks higher than the return on our capital.

Read More

Fed Unloads Its Biggest Bazooka Ever—Markets Crash—Dow Plunges 3,000 Points

Ulli Market Commentary Contact

[Chart courtesy of MarketWatch.com]
  1. Moving the markets

When I was watching the futures markets last night, I already knew that today would not be a good one to be in the markets. Despite the Fed unloading its biggest emergency bazooka ever, by announcing $700 billion in QE and a full 1% reduction in interest rates to “zero,” markets immediately went limit down.

We all know that the Fed’s FOMC meeting was scheduled for this coming Tuesday/Wednesday, and they could not wait 3 extra days to announce their decision?

So, they rushed to do it Sunday night just prior to the futures markets opening. This smelled like a panic move, and the markets took it as such and started the session limit down.

This morning, things did not look better, and the circuit breakers kicked in, as @GreekFire23 summed up:

  1. 9:30am: Ding Ding Ding! Trading open!
  2. 9:30:00001am: Halted

That represents the speed with which we hit limit down. In other words, Friday’s much hyped rebound turned into another dead-cat-bounce, with the major indexes getting slaughtered today by dropping around -12% with the Dow being the worst performer with -12.93%, or just about -3,000 points.

Or, looking at it from another viewpoint, Small Caps and Transportations are down -35% from their highs, and the rest of the majors down around -27%, according to ZH.

We have now seen 2 massive global monetary interventions, and they resulted in a total bloodbath for the markets—and this may only be the beginning.

The carnage was worldwide, with banking stocks in Europe now smashed to a level last seen in 1987, as Bloomberg shows.

The question now is, will the December 2018 lows of the S&P 500 hold? If not, we are bound to go a lot lower.

I am sure, this week will have a lot more surprises in store with many Buy-and-Holders wishing that they had joined us on the sidelines on 2/27.

Read More