Below, please find the latest High-Volume ETF Cutline
report, which shows how far above or below their respective long-term trend
lines (39-week SMA) my currently tracked ETFs are positioned.
This report covers the HV ETF Master List from Thursday’s
StatSheet and includes 322 High Volume ETFs, defined as those with an average
daily volume of more than $5 million, of which currently 31 (last week 91) are
hovering in bullish territory. The yellow line separates those ETFs that are
positioned above their trend line (%M/A) from those that have dropped below it.
In case you are not familiar
with some of the terminology used in the reports, please read the Glossary of Terms.
If you missed the original
post about the Cutline approach, you can read it here.
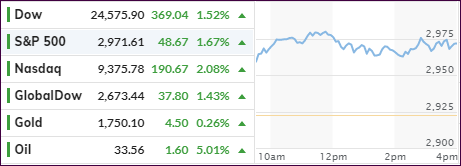
The
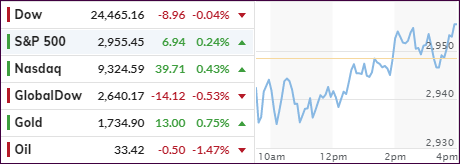
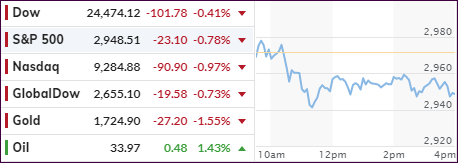
markets finally managed to keep a rebound
rally going after yesterday’s collapse. As I posted, during bear markets, you can
witness violent upswings, but they don’t mean the bearish trend is over.
Today,
we started in the green, as news from Europe that the German FinMin unleashed
their version of a financial bazooka and presented their “whatever it takes moment:”
SCHOLZ SAYS POSSIBLE
GERMANY WILL NEED TO TAKE ON ADDED DEBT;
GERMANY WILL HAVE NO
LIMIT ON CREDIT PROGRAM FOR COMPANIES;
SCHOLZ SAYS GERMANY
WILL SPEND BILLIONS TO CUSHION ECONOMY;
GERMANY PLANS TO SET
UP SAFETY NET FOR VIRUS-HIT COMPANIES;
ALTMAIER: RESOURCES
FOR GERMANY’S STATE BANK TO RISE TO 500BN
That
set the bullish tone for the day, and up we went. Adding hope for a quick response
domestically were reports that House Speaker Pelosi and the Trump
Administration were nearing an agreement on an aid package, to include sick pay
free virus testing and other resources.
Then
it was the Fed’s turn to announce their “whatever it takes moment,” by attempting
to restore some liquidity in the broken overnight lending market by concluding three
of six emergency POMOs (Permanent Open Market Operations) and soaking up billions
of Treasuries of varying maturities.
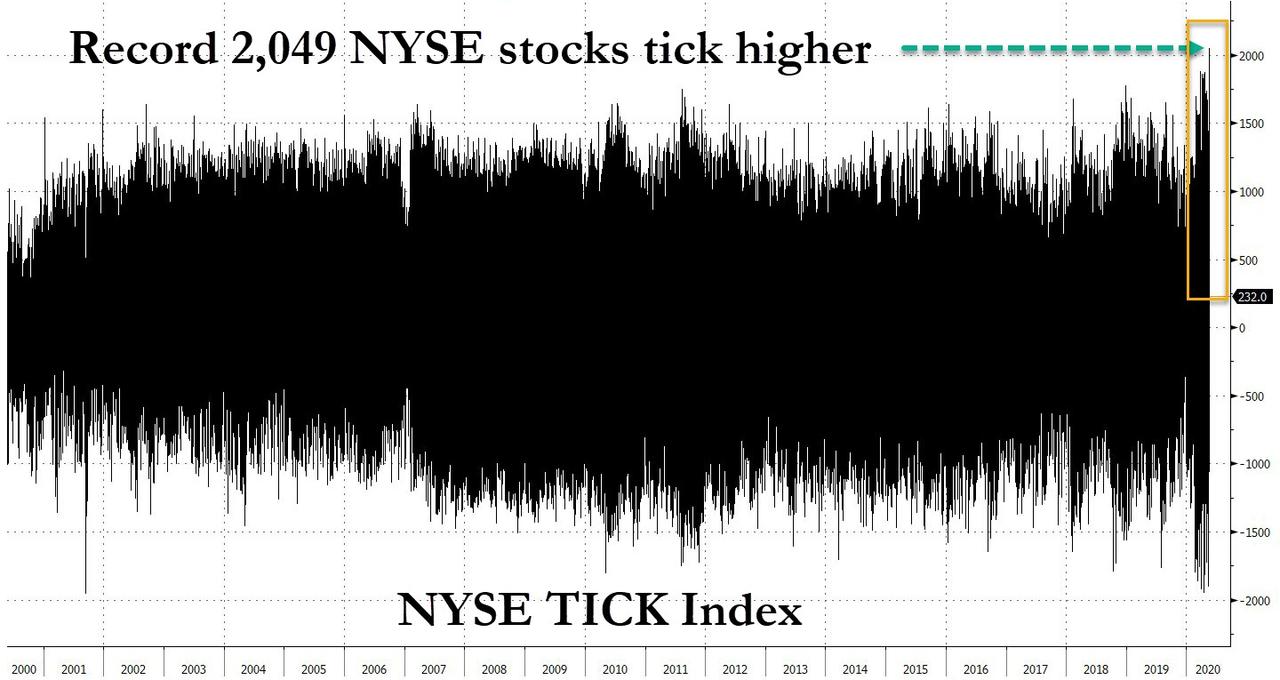
Towards
session end, it was Trump’s stimulus/testing plan that spiked equities to their
biggest gain since October 2008, thereby somewhat offsetting the market’s worst
week since 2008, during which the S&P 500 dropped -8.8%.
Even
diversification did not help, as this week was the worst weekly loss for a
diversified portfolio of stocks and bonds since 2008 with -14.69%, as Bloomberg
points out in this
chart.
Next
week, the Fed will meet, and the markets are “demanding” a full 1% interest rate
cut with Bloomberg providing the graphic representation.
You can be pretty much assured that the Fed will cave and comply, otherwise the
current debacle will continue in an accelerated fashion.
1. From the universe of over 1,800 ETFs, I have selected only those with a
trading volume of over $5 million per day (HV ETFs), so that liquidity and a
small bid/ask spread are assured.
2. Trend Tracking Indexes (TTIs)
Buy or Sell decisions for Domestic and International ETFs (section 1 and
2), are made based on the respective TTI and its position either above or below
its long-term M/A (Moving Average). A crossing of the trend line from below
accompanied by some staying power above constitutes a “Buy” signal. Conversely,
a clear break below the line constitutes a “Sell” signal. Additionally, I use a
7.5% trailing stop loss on all positions in these categories to control
downside risk.
3. All other investment arenas do not have a TTI and should be traded
based on the position of the individual
ETF relative to its own respective trend line (%M/A). That’s why those signals
are referred to as a “Selective Buy.” In other words, if an ETF crosses its own
trendline to the upside, a “Buy” signal is generated. Since these areas tend to
be more volatile, I recommend a wider trailing sell stop of 7.5% -10% depending
on your risk tolerance.
If you are unfamiliar with some of the terminology, please see Glossary of Termsand new subscriber information in section 9.
1. DOMESTIC EQUITY ETFs: SELL
— since 02/27/2020
Click on chart to enlarge
Our main directional indicator, the Domestic Trend Tracking Index (TTI-green line in the above chart) is now positioned below its long-term trend line (red) by -23.80% after having generated a new Domestic “Sell” signal effective 2/27/20 as posted.
In a few decades, historians will look back at the past 10
years and shake their heads in disbelieve at the insane Fed monetary policies
that have kept markets artificially propped up, while “disallowing” any downside
moves beyond a certain “acceptable” percentage.
Though many erroneously attribute the current market
disaster to the coronavirus, that is incorrect. The virus was merely the pin
that pricked the ever-growing bubbles, which would have burst anyway, but we
might have pushed the can down the road a little longer.
ZH and others posted these relevant commentaries:
This bull market will go down in history as the one that nobody believed would last this long. A lot of people have been hurt because their retirement money disappeared…. What brought us to where we are in 2020 is too much hope, sky-high valuations.
Did I see it coming this far? No. Throughout the past 11 years, the market has had a lot of dips, and always the Federal Reserve came to the rescue…. Right now, the Fed is not enough, central bank action is not enough. There is a pyramid of uncertainty right now.
Does the Fed really want to have a put every time the market gets nervous? …Coming off all-time highs, does it make sense for The Fed to bail the markets out every single time… creating a trap?
The Fed has created this dependency and there’s an entire generation of money-managers who … have only seen a one-way street… of course they’re nervous.
The question is – do you want to feed that hunger? Keep applying that opioid of cheap and abundant money?
The market is dependent on Fed largesse… and we made it that way…
At this moment, the crash fest goes on with utter abandon causing one analyst to ask:
“Is the market now like an “Oriental Rug Factory” where “Everything Must Go?”
It certainly
feels that way now, as many leveraged traders are forced to unwind and sell everything,
including safe-haven assets like precious metals, in order to meet margin
calls.
Of course,
in bear markets we can witness and sharp rebounds of great magnitude, but that
does not mean a new bull market is imminent. Case in point was today, when the
Fed fired a bazooka
by unleashing a $1.5 trillion Rep bailout, which means up to $3 trillion in cumulative
repos by the end of the month.
The effect was immediate, as the above chart shows, with the
Dow regaining some 1,500 points within minutes. Unfortunately, this was merely
a dead cat bounce, and the markets resumed their downward trajectory with utter
abandon leaving me pondering as to whether the Fed has finally run out of
ammunition.
However, I expect them to drop rates to zero, or below, and
directly intervene in the markets, just like the Japanese Central Bank does, by
openly buying stocks, bonds and ETFs. We will find out soon.
Yes, the thing that may have been unthinkable 3 weeks ago
is upon us. The bear market has arrived with full force and may be hanging around
for a while.
Being out of the market and on the sidelines never felt
so right.
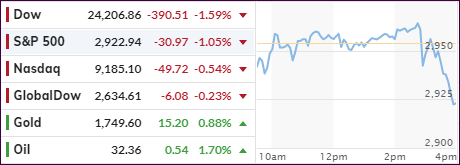
With the benefit of hindsight, yesterday’s hope-based
snap-back rally has now assumed the smell of a dead-cat bounce, with the major indexes
getting hammered, as the Dow touched the commonly recognized bear market territory,
which is a 20% drop from recent highs.
A few headlines combined to eradicate any remaining bullish
sentiment:
Core CPI jumps the highest in 12 years with
services costs soaring
The WHO finally declares the coronavirus a Pandemic
Mnuchin says that broad economic response will
have to wait
Globally, the urge to “do something” accelerated with the
Bank of England delivering an emergency 0.25% interest rate cut while pledging
more fiscal stimulus. Germany’s Merkel promised to do “whatever is necessary,”
while at the same time the ECB President warned of an economic shock like the
2008 financial crisis.
Sure, markets are pricing in an easing of Central Banks,
but the question remains how much firepower is really left, after having been
in easing mode for the past 10 years.
In the meantime, the non-reported crisis in the overnight
repo lending market continues unabated with the Fed having to increase the liquidity
bailout to a stunning $175
billion per day, and the market still keeps collapsing (hat tip to ZH/Bloomberg
for this data). Something is seriously broken, which the Financial
Conditions Index clearly shows.
With the Fed summit next week, the implied rate-change
for the March FOMC meeting is about 82 basis point, as Bloomberg’s chart
demonstrates. That means interest rates are heading to the zero level.
And here’s something I have been commenting on over the years,
namely that during times of extreme market stress, such as we are witnessing
right now, the bond portion in a portfolio will not be able to “save” the equity
portion.
Bloomberg’s
chart shows that the weekly stock and bond combined return was the worst in
11 years (-7.80%), or more specifically since Leman went bankrupt. That supports
my belief that only 100% cash on the sidelines will prevent serious portfolio
damage.
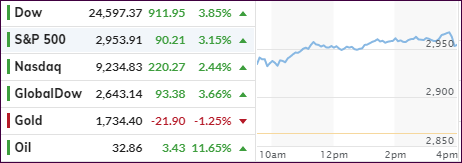
Another wild roller-coaster day in the markets had the
Dow up 900 points early on, after which it tanked and dipped into negative territory
but then went on to rebound and reached new highs for the day, after a last
hour pump, as this
chart demonstrates.
Not that any current issues were resolved but hope for a
fiscal response to the coronavirus scare lifted overall spirits with an assist by
Trump’s proposal for a payroll tax cut.
Historically, today’s rebound is not unusual, as Bespoke Investment
Group strategists found that in the 10 previous times since 1952, that the
S&P 500 fell 5% or more on a Monday, the index has gained the following day
by an average of 4.2%.
While that is noteworthy, it does not imply that the bear
market is over, and all is well again. As officialdom scrambles to come up with
solutions, Trump’s overture to seek payroll tax relief and other measure to
help businesses deal with the virus problem, may be a step in the right direction
and had at least a momentary calming effect on the markets.
Right now, to me this is nothing more than a one-day
bounce, and we will need a lot more to see this move as sustainable and leading
to a new bull run. Technically speaking, the damage lingers with all major indexes
remaining below their 200-day averages.
Fundamentally speaking, the Dow has a long way to catch
down to earnings, as Bloomberg posted here.
While bond yields managed to surge back to the breakeven
point of last Friday’s close, with the 10-year gaining 22 basis points to close
at 0.792%, the untold story lies in the overnight lending market, where the financial
plumbing continues to break and the funding freeze is getting worse.
As I posted before, this is a very complex subject, so
suffice it to say that dealers demanded a record $216 billion in liquidity from
the Fed repo—for one day! ZH summed it up like this:
As we pointed out last week, this continuing
liquidity crunch is not only bizarre, but increasingly concerning, as it means
that not only did the rate cut not unlock additional funding, it actually made
the problem worse, and now banks and dealers are telegraphing that they need
not only more repo buffer but likely an expansion of QE… which will come soon
enough, once the Fed funds hits 0% in a few days and is forced to restart bond
buying to prevent the next crash.
If these issues are not resolved, the next disaster is
bound to start in the bond market, and if it does, it will certainly affect the
equity markets in a big way to the downside.
This is not the time to be a hero by engaging in the fine
art of bottom fishing.