Record Initial Jobless Claims—Markets Rally

Ulli Market Commentary Contact

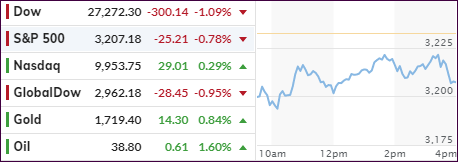
[Chart courtesy of MarketWatch.com]
  1. Moving the markets

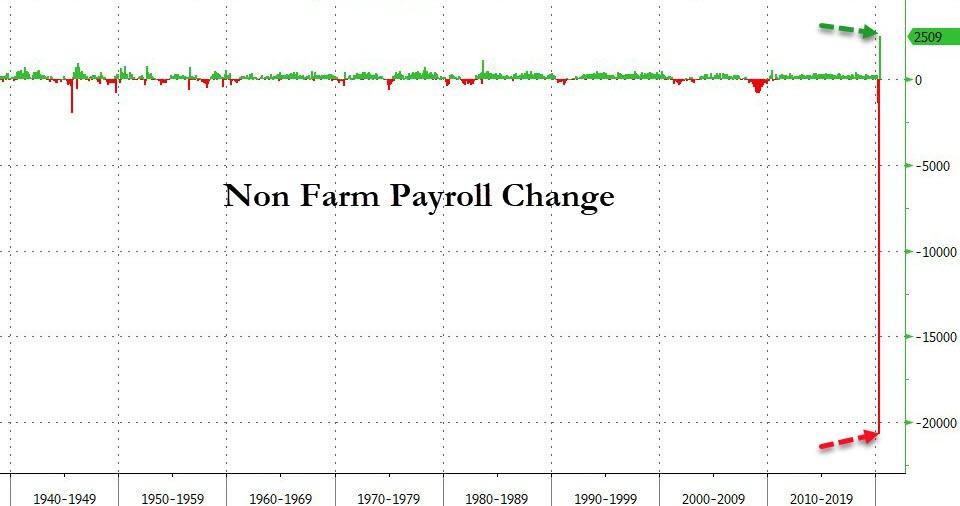
The futures markets crashed into the red last night, despite a strong start to the session. The cause was another unprecedented surge in initial jobless claims, after last week’s record 3.3 million rise, but this week, we added 6.648 million for a two-week grand total of 10 million new people claiming unemployment benefits, as ZeroHedge pointed out.

So, what do you do when you know the markets are about to get slaughtered again?

You create a rumor. And that is exactly what the White House did, as Trump tweeted this:

Just spoke to my friend MBS (Crown Prince) of Saudi Arabia, who spoke with President Putin of Russia, & I expect & hope that they will be cutting back approximately 10 Million Barrels, and maybe substantially more which, if it happens, will be GREAT for the oil & gas industry!

That’s all it took to shift the computer algos into high hear with the Dow at one point being up some 500 points, after which it lost all of its gains and dipped below the unchanged line before recovering and storming back towards the highs of the day.

ZeroHedge clarified the events as follows:

The mid-day volatility was a result of Russia’s energy minister emphasizing that instead of cutting supply, Russia will wait for demand to return.

The Dow Jones news service made it clear that, according to Saudi sources, Trump’s tweet was nothing but a baseless oil price manipulation:

  1. SAUDI OFFICIAL SAY TRUMP’S TALK OF 10 MILLION BBL A DAY CUT OR ABOVE WAS AN EXAGGERATION

Finally, Moscow confirmed where to expect the oil prices in the coming year:

  1. RUSSIA IS SAID TO BASE REVISED 2020 BUDGET PLAN ON $20 OIL

After all this, it makes me laugh out loud how oil prices could have gained 23% and stocks participated with an over 2% advance, while 10 million Americans lost their jobs in 2 weeks’ time.

Maybe, it was simply another overdue dead-cat bounce.

Read More

No Bullish Meat On This Bone

Ulli Market Commentary Contact

[Chart courtesy of MarketWatch.com]
  1. Moving the markets

As the worst quarter in history came to an end with a sell-off, the 2nd quarter started with a bang—but to the downside, leaving the always optimistic Wall Street players gasping. As Barron’s commented, today was the worst first day of a quarter—ever. That’s a lot of “worsts,” and they erased some 50% of last week’s dead-cat-bounce.  

Today, there simply was no bullish meat found on that ageing carcass, with the major indexes spending the entire session below their respective unchanged lines giving the bears an easy victory, as any rally attempts ran into a brick wall of selling.

For sure, not helping matters was Trump’s warning that a “very, very painful” two weeks lie ahead, as we continue to face the rapidly spreading coronavirus epidemic. That indicates that many businesses will remain shut down for at least that period, but I think that timeframe will be extended.

It is now clear that the world’s economies have been and are experiencing a never seen before interruption to industries, small businesses and households, even far worse than what we saw in 2008. The hope that a V-shape type of recovery will be in our near future may not happen, if this shutdown extends for any length of time past the month of April.

Last week’s bullish driver, namely the quarter-end rebalancing act, is now spent and in the rear-view mirror. Another major player that has heavily contributed to the bullish theme over the past few years, corporate buybacks, have disappeared as well with companies having more serious issues than manipulating their stock price via the buyback game.  

That leaves economic data, and possibly the Plunge Protection Team (PPP), to offer market support, the power of either is questionable given current circumstances.

No, I am not being negative. I see a light at the end of the tunnel, the tunnel is just much longer than most anticipate.

Read More

Ending A Miserable Quarter With A Sell-Off

Ulli Market Commentary Contact

[Chart courtesy of MarketWatch.com]
  1. Moving the markets

An early rebound hit a brick wall, as this month/quarter turned out to be nothing but misery for the buy-and-hold crowd. To wit, during March, the major indexes lost big time with the S&P 500 plunging -12.5% vs. 0% for those who followed my trend tracking guidelines, which called for “all cash” effective 2/27/20.

Keep in mind that the -12.5% loss for the S&P 500 happened despite a huge rebound last week, which was powered by massive quarterly-ending rebalancing efforts. Otherwise, the index would have been down over 30%. In the end, the S&P 500 ended “only” down some -20% for the quarter. Ouch!

Much of this market deterioration has been blamed on the coronavirus, but this virus was merely a bug in search of a windshield, and it finally found one. As I posted before, the financial markets were long overdue for a serious correction, and Covid-19 was purely the pin that pricked the bubble.

Helping today’s early bullish theme were preliminary reports of what’s in store with consumer confidence, Chicago PMI and Chinese manufacturing, which were coming in better than expected, but I don’t think that encompasses the month of March, during which econ numbers look to have taken a steep dive with the country shutting down.

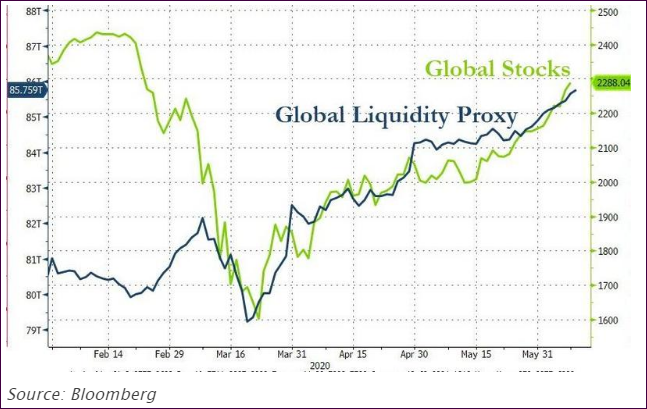
ZeroHedge posted the question: So, how bad was Q1? And answered it with this chart confirming that it was the world’s biggest quarterly capitalization loss in bonds and stocks ever…during which stocks lost a record-smashing $19.6 trillion…

So, the big question is “how low can we go?” While no one has that answer, one argument is that markets need to adjust to forward earnings. If that is true, as Bloomberg demonstrates in this chart, somewhere in the neighborhood of 1,600 for the S&P 500 might be a stopping point.

No one knows if that will happen, but I think it’s a possibility, so my preference, for the time being, is watching this develop from the sidelines.

Read More

Quarter-End Rebalancing Props Up Markets

Ulli Market Commentary Contact

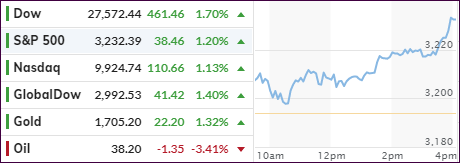
[Chart courtesy of MarketWatch.com]
  1. Moving the markets

Despite Trump’s announcement Sunday night that he had extended the social distancing guidelines through April 30th, which translates into a continued shutdown of food, entertainment and other service industries, you would not know it by today’s market reaction.

After a sight opening dip, the bullish theme was maintained, and the major indexes were pumped into the close. Sure, some of the traders’ attention was focused on the efforts to slow down the spread of the virus, but news reports did not show any earthshattering improvements.

It seems that the quarter-end balancing, which contained another $150 billion in re-allocations, according to ZeroHedge, was enough to sustain the bullish theme for another day. We may see another push higher tomorrow, but I doubt that this will carry into April.

Just as noteworthy has been the crude oil crash, down another 6% today, with the $20 level about to be taken out soon, with some futures already trading at $13.30. Bloomberg posted this chart for clarity.  

To me, the always interesting and entertaining comparisons to historical events, such as past market crashes, may have some validity, with Bloomberg posting the latest comparing the S&P now compared to 2008 in this chart. We will soon find out how this analog holds up, and my guess is that more clarity will set in during the month of April.

Despite last week’s rebound, we’re still stuck in bear market territory, and I believe the downward trend will continue but will be interrupted by breathtaking rebounds from time to time.

Right now, it pays to be safe than sorry.

Read More

ETFs On The Cutline – Updated Through 03/27/2020

Ulli ETFs on the Cutline Contact

Below, please find the latest High-Volume ETF Cutline report, which shows how far above or below their respective long-term trend lines (39-week SMA) my currently tracked ETFs are positioned.

This report covers the HV ETF Master List from Thursday’s StatSheet and includes 322 High Volume ETFs, defined as those with an average daily volume of more than $5 million, of which currently 33 (last week 20) are hovering in bullish territory. The yellow line separates those ETFs that are positioned above their trend line (%M/A) from those that have dropped below it.

Take a look:                                                                   

The HV ETF Master Cutline Report

In case you are not familiar with some of the terminology used in the reports, please read the Glossary of Terms. If you missed the original post about the Cutline approach, you can read it here.      

ETF Tracker Newsletter For March 27, 2020

Ulli ETF Tracker Contact

ETF Tracker StatSheet          

You can view the latest version here.

ENDING THE WEEK ON A SOUR NOTE

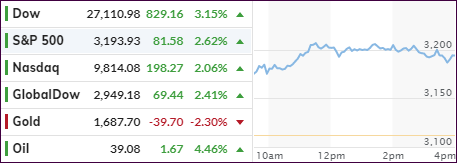
[Chart courtesy of MarketWatch.com]
  1. Moving the markets

After trying to dig themselves out of an early hole, the major indexes dove into the close and just about touched the lows of the day again, caused by the Fed’s announcement that it will reduce Treasury QE from $75 billion to $60 billion per day, thereby removing the much wanted “unlimited QE” from their vocabulary.

Despite today’s set back, the S&P 500 managed a gain of some 10% for the week with some pundits claiming this rebound to be the end of the bear market.

As I posted before, markets don’t work that way, since it is a normal occurrence in bearish periods to the see reversals of a magnitude, you’ll never experience in bull markets.

What we witnessed this week, also serves as a great answer to those who question why I don’t immediately go short after a trend line break to the downside. It’s too early for that kind of action due to the ever-present volatility. The idea of nibbling at short positions comes more into play, once a slow, steady and continued downward trend has been established.

Despite Trump being scheduled to sign the government stimulus plan after the close, it was not enough of an event to keep the bullish theme alive. I expected a pullback into the weekend. After all, there could be a host of new and negative developments, not just related to the virus but also to the crisis in the LIBOR market, that nobody with a clear-thinking mind would want to be caught with long positions.

So, was this a sucker’s rally? While that is too early to tell, I must agree with JC Parets at AllStarCharts, who summed it up like this:

“I think you have to be a fool to actually think that the stock market moving an arbitrary 20% in either direction means anything to anyone anywhere in the world.”

Yes, it will take a lot more than a 3-day 20% rebound of the temporary bottom, after the massive fall we’ve seen, to establish a new bullish trend, like broad participation and a host of moves of less than 1% per day.

So far, the comparison to the events of 1929/30 are on target, as Bloomberg shows in this updated chart. It’s important to note that every drop was followed by a dead-cat-bounce, until the final low occurred some 2.5 years later.

I for one am curious to see if history repeats itself.

Read More