Below, please find the latest High-Volume ETF Cutline report, which shows how far above or below their respective long-term trend lines (39-week SMA) my currently tracked ETFs are positioned.
This report covers the HV ETF Master List from Thursday’s StatSheet and includes 322 High Volume ETFs, defined as those with an average daily volume of more than $5 million, of which currently 75 (last week 60) are hovering in bullish territory. The yellow line separates those ETFs that are positioned above their trend line (%M/A) from those that have dropped below it.
In case you are not familiar with some of the terminology used in the reports, please read the Glossary of Terms. If you missed the original post about the Cutline approach, you can read it here.
See if this makes sense to you. Today’s data released by the U.S. Labor Department (BLS) showed that we now have the worst unemployment rate since the Great Depression with 14.7%, while 20.5 million are out of work.
As a result, the markets rallied, presumably because the headline number was “less worse” than some estimates for 22 million unemployed. The fact that a broader measure of unemployment, that includes discouraged job seekers and other people on the fringes of the labor market, skyrocketed to a record 22.8%, was conveniently ignored. Wow, I am not making this up.
ZeroHedge added that this drop in unemployment is the biggest in history, and 10 times more than the 2 million jobs lost at the peak of the Great Depression.
Some clarification from the BLS:
Due to the impact of the COVID-19 pandemic, the relationship between the two was no longer stable in April. Therefore, the establishment survey made modifications to the birth-death model.
If the workers who were recorded as employed but absent from work due to “other reasons” (over and above the number absent for other reasons in a typical April) had been classified as unemployed on temporary layoff, the overall unemployment rate would have been almost 5 percentage points higher than reported (on a not seasonally adjusted basis).
In other words, the real unemployment rate is about 20%!
Since most of the above was generally as expected, the headline-scanning computer algos simply discounted this surreal economic weakness in view of some progress made towards the reopening of seized-up economies not just here but abroad as well, despite an only gradual loosening of restrictions. As if we could flip a switch and all be back to normal…
Even Morgan Stanley’s base bull scenario adds another year to the recovery, while the bear case sees double-digit unemployment into 2022 an onward—and that is assuming there is no second round of closures in late 2020.
With 52% of small businesses expecting to be “out of business” within 6 months, there will be no quick recovery, let alone a V-shaped one. I doubt that this has been priced in the markets.
In the meantime, the bear market rebound rocks on, but it remains to be seen if it has enough momentum to push our Trend Tracking Indexes (TTIs) back into bullish territory.
1. From the universe of over 1,800 ETFs, I have selected only those with a trading volume of over $5 million per day (HV ETFs), so that liquidity and a small bid/ask spread are assured.
2. Trend Tracking Indexes (TTIs)
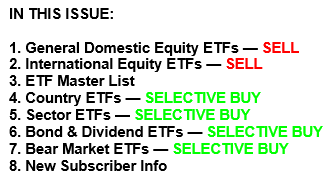
Buy or Sell decisions for Domestic and International ETFs (section 1 and 2), are made based on the respective TTI and its position either above or below its long-term M/A (Moving Average). A crossing of the trend line from below accompanied by some staying power above constitutes a “Buy” signal. Conversely, a clear break below the line constitutes a “Sell” signal. Additionally, I use a 7.5% trailing stop loss on all positions in these categories to control downside risk.
3. All other investment arenas do not have a TTI and should be traded based on the position of the individual ETF relative to its own respective trend line (%M/A). That’s why those signals are referred to as a “Selective Buy.” In other words, if an ETF crosses its own trendline to the upside, a “Buy” signal is generated. Since these areas tend to be more volatile, I recommend a wider trailing sell stop of 7.5% -10% depending on your risk tolerance.
If you are unfamiliar with some of the terminology, please see Glossary of Termsand new subscriber information in section 9.
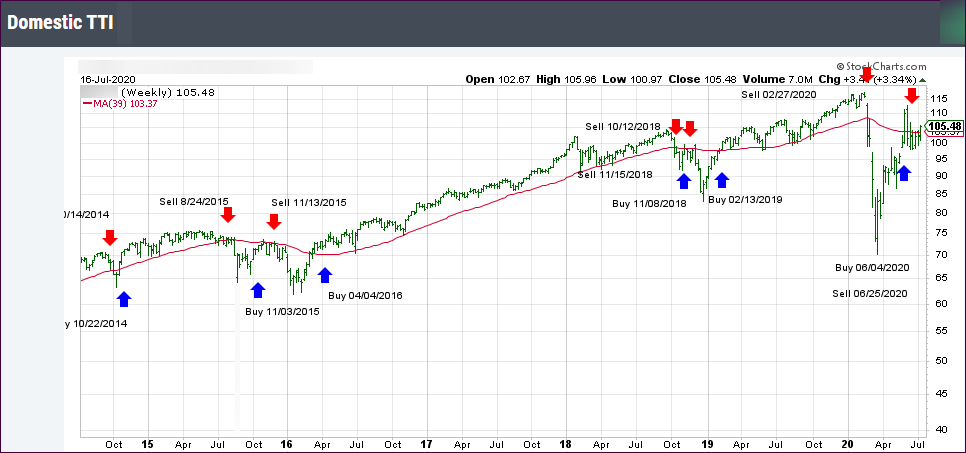
1. DOMESTIC EQUITY ETFs: SELL— since 02/27/2020
Click on chart to enlarge
Our main directional indicator, the Domestic Trend Tracking Index (TTI-green line in the above chart) is now positioned below its long-term trend line (red) by -10.90% after having generated a new Domestic “Sell” signal effective 2/27/20 as posted.
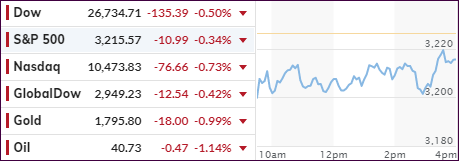
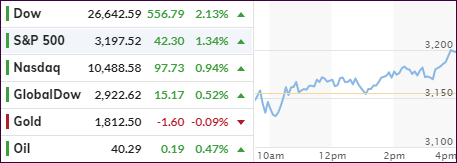
An early 400-point gain in the Dow got cut in half, but at least all three major indexes managed a green close.
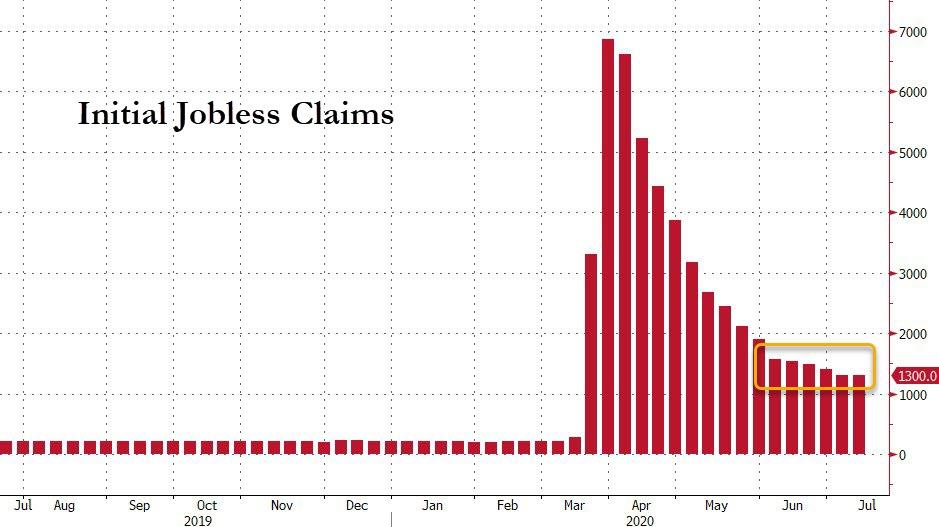
Jobless claims jumped by “only” 3.2 million in early May, which traders viewed as a slowing in job losses with some States now beginning to reopen their economies. The reality is that this still represents a 1576.9% surge in job cuts, according to Challenger, Gray and Christmas, with Bloomberg charting this fact here.
Leave it up to ZeroHedge to sum up the debacle of the last few months like this:
COVID-America: 73,400 Dead; 33 Million Jobless; Stocks Soaring
The initial jobless claims chart shows an improvement, which makes you wonder if that indeed warrants the current stock markets levels. After all, in the past 7 weeks, job losses now total 33.48 million, which is over 12 times the prior worst five-week period in the last 50-plus years.
For sure, without the Fed throwing trillions of dollars of liquidity at the markets, we would be nowhere near current valuations.
Current market reaction assumes that the reopening of the country happens swiftly, effectively and with everyone returning to their previous jobs. I disagree, and so does Michael Every of Rabo Bank:
“For all of us, as we re-open May will show us just how many firms are going to fail in this new post-lockdown normal. US ADP jobs printing at minus 20 million yesterday and media reports that temporary job furloughs are becoming permanent ones says we should expect a deluge to follow.”
Even Minneapolis Fed mouthpiece Neel Kashkari came out opining on tomorrow’s jobs report:
“It will likely understated the real unemployment picture, as it will only reflect people who are actively looking for work, a nearly impossible task in a time of nationwide lockdowns, and that the country should steel itself for a long, gradual recovery.”
“Friday jobs report that covers April will likely show an unemployment rate of 16% or 17%, but that the real number is around 23% or 24%, adding that “it’s devastating.”
While these are only opinions, they are supported by the fact that some of the bond yields have hit record lows. We saw forecasts that negative rates are about to come true in a few months and are priced in for Q4 2020. The 2-year took out its previous record low today. All this was positive for gold, which rallied over 2%.
The decoupling from reality continues and, when looking at a global level, the picture looks just as bleak as domestically.
Right now, I am curious as to how much positive upward momentum the computer algos can squeeze out of tomorrow’s jobs report.
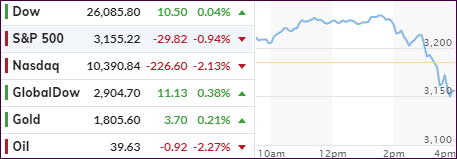
It was a tug-of-war throughout the session, as an early rally died on the vine with two of the three major indexes diving into the red during the last 30 minutes. The exception was the Nasdaq, which managed to stay above the unchanged line but had to give up more than 50% of its early gains.
Amazingly, the markets were able to overcome ADP’s report of a loss of over 20 million private sector jobs in April, a number that is unprecedented. Bloomberg demonstrates in this sobering chart how this figure compares to history. It does not. This is mindboggling when considering that during the Great Financial Crises, some 10 years ago, the largest monthly job loss was “only” 834,700!
In the end, this reality check was too great to overcome causing the sell-off with nervousness spreading in anticipation of tomorrow’s weekly jobless claims data and Friday’s monthly nonfarm payrolls and unemployment report.
You have to laugh at the performance of the Nasdaq, which continues to rally in the face of collapsing earnings, thereby presenting a picture that is clearly distorted to say the least. This disconnect between markets and data is now the largest on record.
This abnormality is not exclusive to the Nasdaq, many major indexes are sporting the same kind of divergence, as Goldman Sachs points to in this chart.
According to Nomura’s McElligott the rally is now done, at least for the next few months, and as the Nomura strategist writes, “his sense is ‘lower’ for the next move across the Summer months, as I think the market’s current pragmatism towards the virus in conjunction with the “feel-good” of the rally leaving it exposed to the downside of a coming second-wave as cases, as restrictions ease and some States rush back to “normalcy”…yet with fewer Fed and fiscal bullets in the chamber next time around.”
While that is only one man’s opinion, I believe caution is still warranted until that moment in time when our Trend Tracking Indexes (TTIs) show enough upward momentum to generate a new “Buy” signal.
An early rally got cut in half by the end of the session, when Fed Vice chairman Clarida opined that more support for the economy was needed, but he expects a rebound by next quarter, despite the current massive drop in unemployment and GDP.
He noted:
“More policy support will be needed from the Fed and possibly also fiscal policy. It just depends on how this evolves.”
“Realistically, it’s going to take some time for the labor market to recover from this shock. I do think the recovery can commence in the second half of the year.”
“The Fed will employ “forceful, proactive, and aggressive” policies “until we’re comfortable the economy is on the road to recovery, especially for Main Street. We can’t minimize that we are in a recession here.”
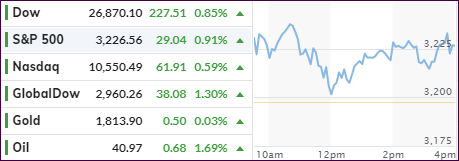
This was not what markets had expected, especially not the “R” word, so south we went, but the major indexes still managed to come out with some decent gains.
The fact that the markets are too optimistic was brought home by Nomura’s managing director, Charlie McElligott:
“Summer could bring hard economic data collapsing like we’ve never seen before, terrible corporate guidance, stories of pending bankruptcies, and a second wave of layoffs that will hit the white-collar sector. Rising trade-war rhetoric from the White House as a presidential election campaign heats up could present more risk.”
“That’s why I think folks are getting ready to hit the wall again, with this idea we’ve moved out of stabilization and now we’re back into the harsh reality of what this is, without having a Federal Reserve boost and no more stimulus checks until things get a lot worse.”
“The good news? The September to December period could look more constructive for equities, though much depends on if we get hit by a second wave of the virus.”
Nobody knows what’s next, but if Bloomberg’s chart is correct, the disconnect will continue until the S&P 500 snaps back down to the Copper/Gold ratio, the direction of which was spot on earlier this year.