
- Moving the markets
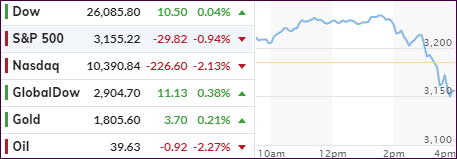
The bullish train kept on moving throughout the early part of the session, when suddenly the wheels came off, and the major indexes engaged in a swan dive, which was led in magnitude by none other than the Nasdaq.
Of course, the tech sector has been on a relentless ramp since the March lows by outperforming all other indexes. Hence, it is not surprising that it would lead on the way down as well.
The Dow held up the best by closing at its unchanged line, with the S&P surrendering -0.94% and Nasdaq being hit the hardest with -2.13%.
The initial sharp rally was fed by news from the FDA agreeing to grant “fast track” status to a couple of vaccines produced by Pfizer and a German biotech firm, which caused to the Nasdaq scoring another intraday high before hitting the skids.
Contributing to the sudden demise in sentiment was CA gov Newsom’s announcement to roll back the re-opening status to phase 1, which means closure of bars, gyms, indoor dining, movies, wineries, zoos, museums, etc.
In other words, we are going backwards, and those business barely in recovery and survival mode will have to deal with these consequences again. I am afraid, many will not survive this time.
On the other hand, the higher the number of Covid cases, and the more layoffs, the more bullish it is for stocks, commented Rabobank’s Michael Every:
… for the stock market to move substantially from this point on – since the market is now fully disconnected from fundamentals and is simply a derivative of endogenous liquidity and fund flow – Powell will need to find another justification to expand the Fed’s QE aggressively, as discussed in “JPMorgan Spots A Big Problem For Stocks.” Something like – for example – a second wave of the coronavirus pandemic.
Added ZH:
Michael is right, of course, however now that central banks basically have full control over capital markets, his job “to understand what the market is doing” basically boils down to just one thing – as Goldman explained, all investors care about first thing in the morning is whether to fight or follow the Fed. The rest no longer matters.
Such is the world we are living in and trying to guess what the markets will be doing is an exercise in futility. That is why we let long-term market direction determine our decision-making process, which includes heading for the sidelines, once our indicators flash the signal.
- ETFs in the Spotlight
In case you missed the announcement and description of this section, you can read it here again.
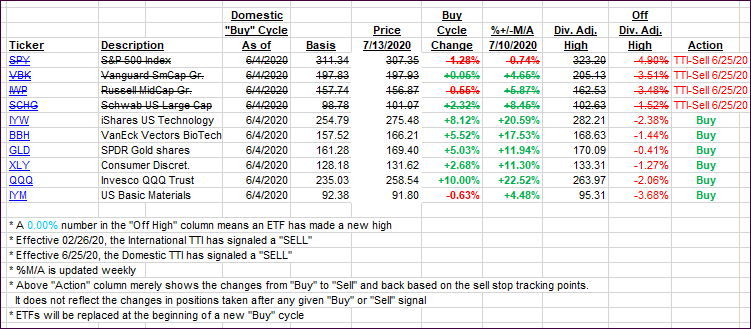
It features some of the 10 broadly diversified domestic and sector ETFs from my HighVolume list as posted every Saturday. Furthermore, they are screened for the lowest MaxDD% number meaning they have been showing better resistance to temporary sell offs than all others over the past year.
The below table simply demonstrates the magnitude with which these ETFs are fluctuating above or below their respective individual trend lines (%+/-M/A). A break below, represented by a negative number, shows weakness, while a break above, represented by a positive percentage, shows strength.
For hundreds of ETF choices, be sure to reference Thursday’s StatSheet.
For this new domestic “Buy” cycle, which ended effective 6/25/2020, here’s how some our candidates have fared:
Click image to enlarge
Again, the %+/-M/A column above shows the position of the various ETFs in relation to their respective long-term trend lines, while the trailing sell stops are being tracked in the “Off High” column. The “Action” column will signal a “Sell” once the -8% point has been taken out in the “Off High” column. For more volatile sector ETFs, the trigger point is -10%.
3. Trend Tracking Indexes (TTIs)
Our TTIs showed a mixed picture with the Domestic one slipping and the international one gaining.
This is how we closed 07/13/2020:
Domestic TTI: -1.73% below its M/A (prior close -1.27%)—Sell signal effective 06/25/2020
International TTI: -0.68% below its M/A (prior close -1.12%)—Sell signal effective 02/26/2020
Disclosure: I am obliged to inform you that I, as well as my advisory clients, own some of the ETFs listed in the above table. Furthermore, they do not represent a specific investment recommendation for you, they merely show which ETFs from the universe I track are falling within the specified guidelines.
Contact Ulli