
- Moving the markets
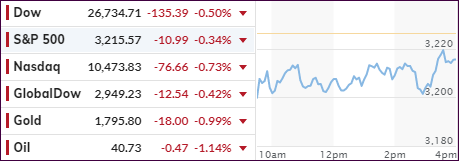
Yesterday’s hard-fought gains vanished in a hurry with bearish sentiment taking over by pulling the major indexes off their lofty levels right after the opening bell. We ended up off the lows but still in the red.
Contributing to the drop were mixed corporate earnings and questionable econ data, as well as an early drop in the Asian markets. Chinese stocks suffered their biggest one-day loss since the beginning of the pandemic.
Domestically, tech stocks/ETFs have been on a tear YTD but are starting to look a little wobbly, yet they are not even close to triggering their respective trailing sell stops.
Big banks so far have delivered earnings in line with expectations mainly by showing outsized gains in their trading divisions, but BofA stumbled somewhat due to concerns about the boost in its loan loss provisions. However, with the bar set extremely low for second quarter earnings, it comes as no surprise that any “beat” will be cheered as a bullish event by the headline scanning computer algos.
Despite hopes for a recovery, non-farm payroll data continued to paint a not so good picture, as over 50 million Americans have now filed for first-time jobless benefits since the lockdown began. Today’s data showed another 1.3 million first time filings vs. an expected 1.25 million, according to ZH, with Bloomberg adding the visual picture.
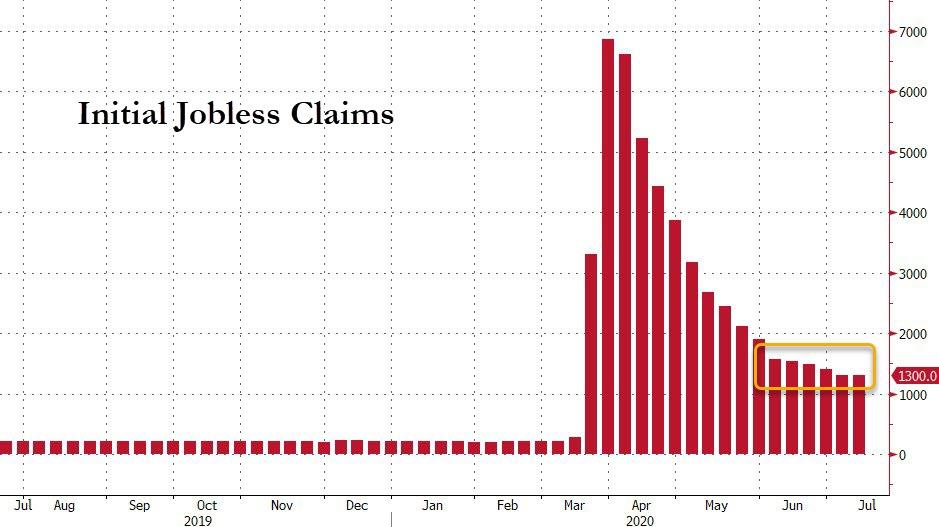
It’s no secret that the Fed is controlling the markets, and we are ever so close to face a managed economy. I grew up in one, but you probably did not, so Michael Every from Rabobank explained about an economy that could never keep supply matching consumer demand, such as the old Soviet system was famous for:
A man goes into the Soviet car showroom and asks to buy a car. The disinterested salesman doesn’t even put out his cigarette and says, “We only take 100% cash payments.” The man puts down a bag full of rubles on the table. The salesman sits up and counts them greedily.
“The only color is grey,” he informs the customer as he counts.
“No problem,” the man replies. “When will it arrive?”
The salesman slowly looks through a dog-eared book and says “Mmm…….five years from today.”
The customer nods sagely; and then asks: “Morning or afternoon?”
“What do you care morning or afternoon?” asks the salesman “It’s five years from now!”
“Well,” says the customer, “I am getting my fridge in the morning.”
It struck my funny bone and hopefully this moment of lightheartedness can bring smile on your face in this all too uncertain world.
2. ETFs in the Spotlight
In case you missed the announcement and description of this section, you can read it here again.
It features some of the 10 broadly diversified domestic and sector ETFs from my HighVolume list as posted every Saturday. Furthermore, they are screened for the lowest MaxDD% number meaning they have been showing better resistance to temporary sell offs than all others over the past year.
The below table simply demonstrates the magnitude with which these ETFs are fluctuating above or below their respective individual trend lines (%+/-M/A). A break below, represented by a negative number, shows weakness, while a break above, represented by a positive percentage, shows strength.
For hundreds of ETF choices, be sure to reference Thursday’s StatSheet.
For this new domestic “Buy” cycle, which ended effective 6/25/2020, here’s how some our candidates have fared:
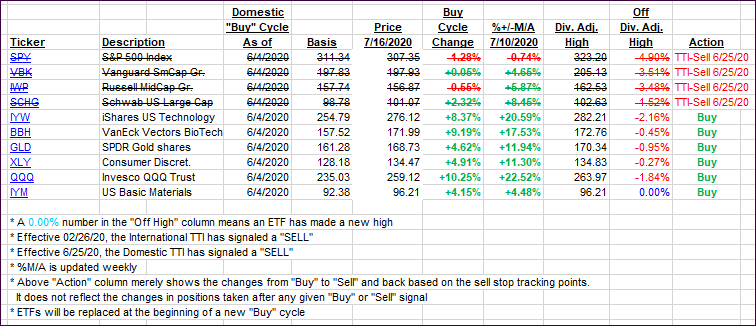
Click image to enlarge
Again, the %+/-M/A column above shows the position of the various ETFs in relation to their respective long-term trend lines, while the trailing sell stops are being tracked in the “Off High” column. The “Action” column will signal a “Sell” once the -8% point has been taken out in the “Off High” column. For more volatile sector ETFs, the trigger point is -10%.
3. Trend Tracking Indexes (TTIs)
Our TTIs gave back some of yesterday’s gains but remain on the bullish side of their respective trend lines. This is only day 2, and we’ll need a little more upside confirmation before pulling the trigger.
This is how we closed 07/16/2020:
Domestic TTI: +2.03% above its M/A (prior close +2.18%)—Sell signal effective 06/25/2020
International TTI: +0.86% above its M/A (prior close +1.23%)—Sell signal effective 02/26/2020
Disclosure: I am obliged to inform you that I, as well as my advisory clients, own some of the ETFs listed in the above table. Furthermore, they do not represent a specific investment recommendation for you, they merely show which ETFs from the universe I track are falling within the specified guidelines.
Contact Ulli