
- Moving the markets
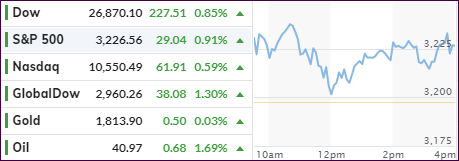
An early ramp ran into resistance with the major indexes pulling back sharply, and the Nasdaq dipping into the red, but a mid-session bounce pulled stocks out of the doldrums and into a green close. Today’s session was a lot choppier than yesterday’s rebound.
Supporting the continued bullishness was the Fed’s account of business activities in its 12 districts, which showed activity picking up, but sluggishness from the fallout of Covid-19 still being a factor. In other words, uncertainty reigns and a wave of layoff lurk on the horizon.
Given that, traders focused on some bright spots in second quarter earnings and the never-ending race for a vaccine. Moderna Inc. put itself back in the limelight and got the bulls roaring early on as its coronavirus candidate produced a “robust” immune system response in a larger group of people, according to MarketWatch.
But:
“Solicited adverse events that occurred in more than half the participants included fatigue, chills, headache, myalgia, and pain at the injection site,” the report states. Fever, joint pain, and nausea were also reported.
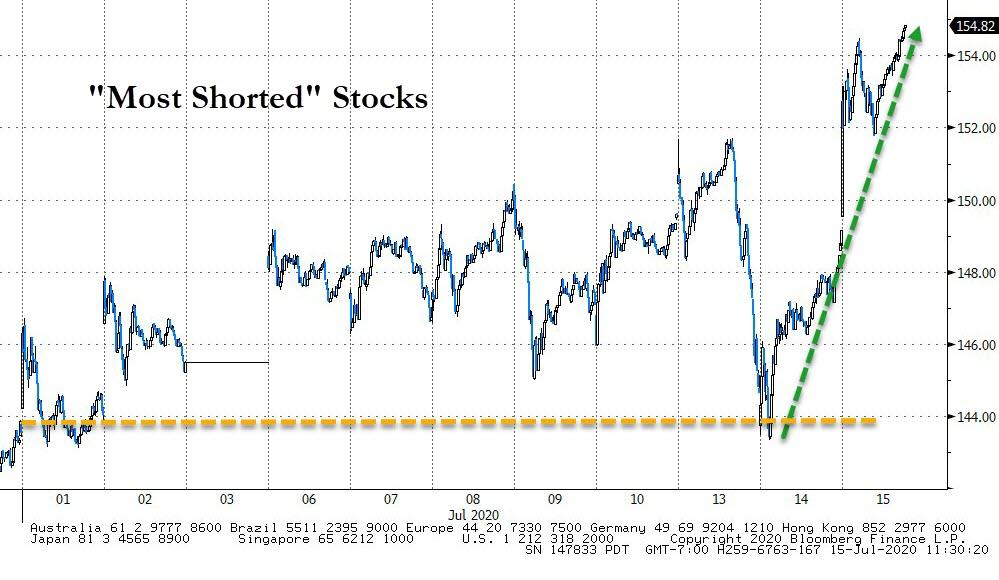
Helping the bullish Moderna story was a massive short squeeze, the biggest in 3 months, reported ZH, but it did not help the S&P 500 conquer critical resistance after testing it four times today.
The Nasdaq lagged in performance, but broad-based advances assisted our Trend Tracking Indexes (TTIs) to conquer their respective long-term trend lines to the upside.
See section 3 for more details.
2. ETFs in the Spotlight
In case you missed the announcement and description of this section, you can read it here again.
It features some of the 10 broadly diversified domestic and sector ETFs from my HighVolume list as posted every Saturday. Furthermore, they are screened for the lowest MaxDD% number meaning they have been showing better resistance to temporary sell offs than all others over the past year.
The below table simply demonstrates the magnitude with which these ETFs are fluctuating above or below their respective individual trend lines (%+/-M/A). A break below, represented by a negative number, shows weakness, while a break above, represented by a positive percentage, shows strength.
For hundreds of ETF choices, be sure to reference Thursday’s StatSheet.
For this new domestic “Buy” cycle, which ended effective 6/25/2020, here’s how some our candidates have fared:
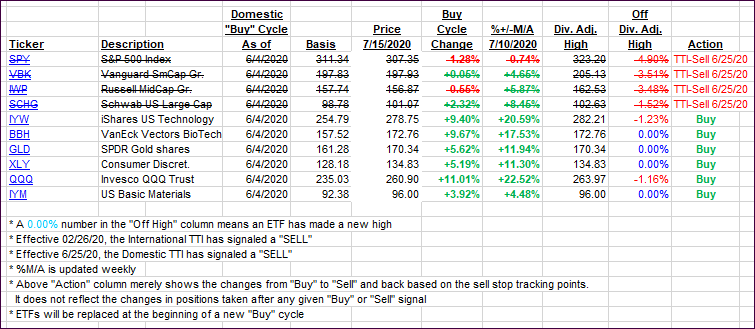
Click image to enlarge
Again, the %+/-M/A column above shows the position of the various ETFs in relation to their respective long-term trend lines, while the trailing sell stops are being tracked in the “Off High” column. The “Action” column will signal a “Sell” once the -8% point has been taken out in the “Off High” column. For more volatile sector ETFs, the trigger point is -10%.
3. Trend Tracking Indexes (TTIs)
Our TTIs finally moved in sync by simultaneously breaking above their respective trend lines and therefore into bullish territory. Since this was first peek “above the line,” I will wait for some staying power before issuing new “Buy” signals.
Due to many sector funds having been on a bull run, this potential “Buy” signal will not have much of an effect on decisions in my advisor practice, since we already have taken advantage of other opportunities. Nevertheless, it will be additional confirmation that more upside potential exists.
This is how we closed 07/15/2020:
Domestic TTI: +2.18% above its M/A (prior close -0.14%)—Sell signal effective 06/25/2020
International TTI: +1.23% above its M/A (prior close -0.06%)—Sell signal effective 02/26/2020
Disclosure: I am obliged to inform you that I, as well as my advisory clients, own some of the ETFs listed in the above table. Furthermore, they do not represent a specific investment recommendation for you, they merely show which ETFs from the universe I track are falling within the specified guidelines.
Contact Ulli