
- Moving the markets
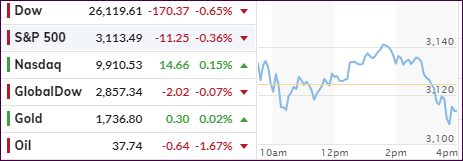
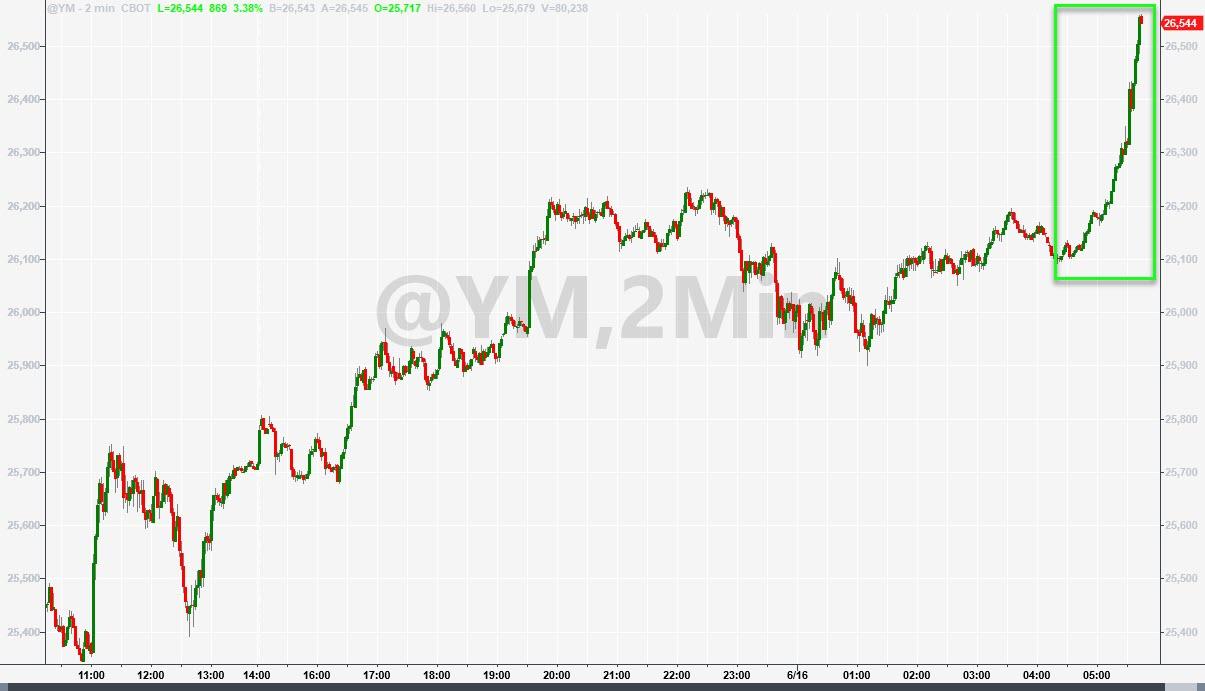
After three days of gains, the major indexes traded near their respective unchanged lines but dove into the red during the last hour. The exception was the Nasdaq, which gave up mid-day gains but ended up in the green.
Contributing to the sell-off were reports that coronavirus cases were on the rise in at least 9 US states and China, but hope remains that a quick recovery will be still possible. Fed chair Powell continued with his second day testimonial before Congress, and while emphasizing the lasting toll of the pandemic, he also suggested that unemployment benefits should be extended.
Powell also said some form of unemployment insurance should continue past the expiration date of July 31 and defended the central bank’s more than $2 trillion slate of emergency funding to keep credit flowing during the pandemic.
Overall, the trading range of the indexes was relatively small, but that could change in a hurry with an uptick in volatility.
As ZH explained, first, there is a massive option expiration set for this Friday the 19th with some $1.8 trillion in SPX options to expire, which makes it the 3rd largest non-December expiration on record.
Second, there is massive pension selling ahead towards the end of the month, at the tune of $76 billion, due to outperformance of stocks over bonds this quarter. The required rebalancing makes this an unavoidable event.
The question is: “How much downside will come into play and will it affect our current bullish theme?”
Since no one has that answer, we will need to be prepared for either scenario.
Read More

