
- Moving the markets
The futures already had pointed to a weak opening, as traders, after digesting Fed head Powell’s news conference, despite being dovish in nature, saw more negatives than positives. Despite the recent bullish theme in the indexes, Powell admitted that not all is well under then hood of the economy.
Additionally, reports covering some 21 states that Covid 2.0 may have arrived was enough to bring out the bears in full force.
With the stock market being Trump’s report card, Treasury Secretary Mnuchin emerged and tried to calm down the nervous nellies on Wall Street by promising more money to be pumped into the economy. ZH summed up his appearance:
- MNUCHIN SAYS OVER NEXT MONTH ANOTHER $1 TRILLION WILL BE PUMPED INTO U.S. ECONOMY
- MNUCHIN SAID ‘WE CAN’T SHUT DOWN THE ECONOMY AGAIN’
- MNUCHIN ‘QUITE OPTIMISTIC’ IN MEDICAL PROGRESS THAT HAS BEEN MADE ON COVID-19
- MNUCHIN SAYS FURTHER AID TO STATES WILL BE SUBJECT TO DISCUSSION WITH CONGRESS
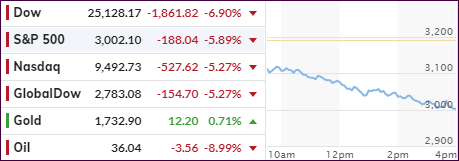
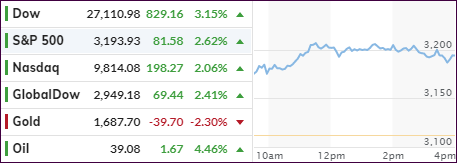
Unfortunately for him, the markets were oblivious to his announcements and proceeded to plunge lower.
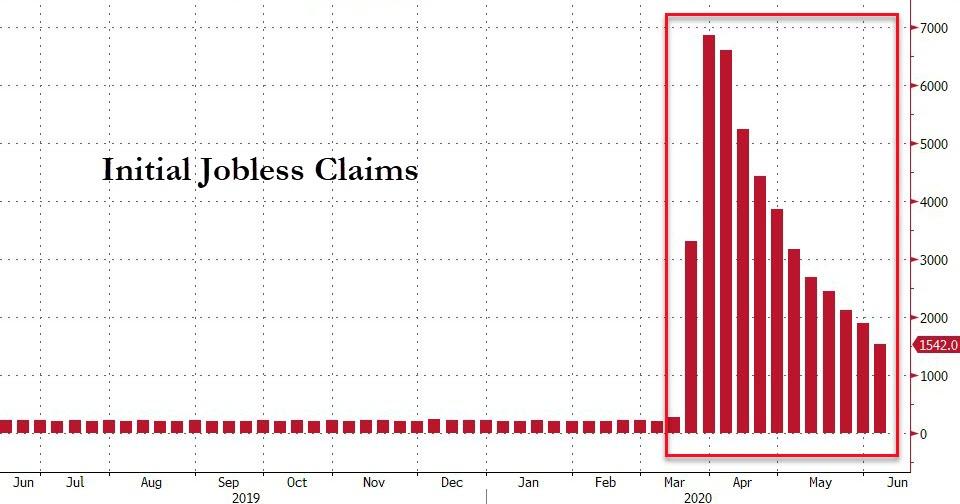
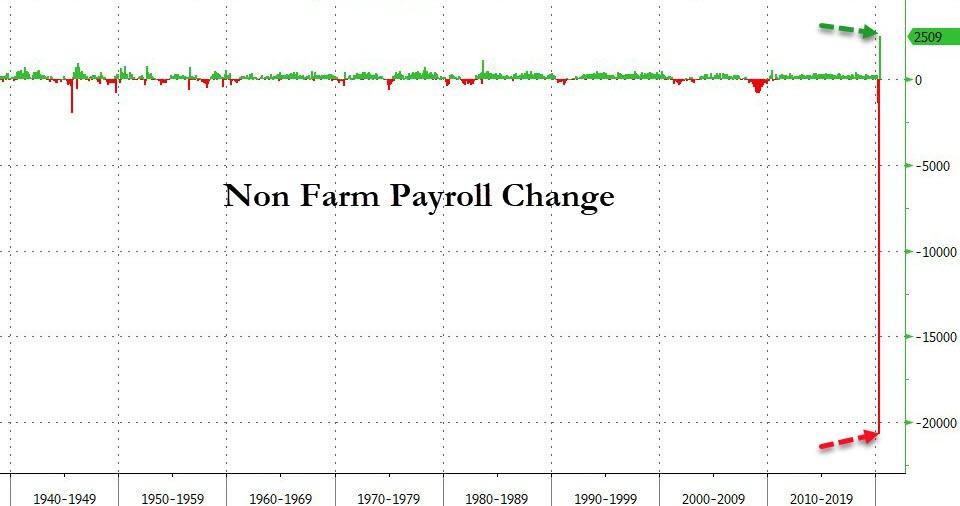
Economic data points supported the downward theme with jobless claims continuing to surge as 1.542 million more Americans filed for unemployment benefits for the first time vs. expectations of 1.55 million.
Just as poorly received, and clearly demonstrating the aftereffects of Covid-19, was data showing that one third of renters are worried about making the next payment, while 17% did not pay their last month’s rent.
The survey showed 11% of households with a mortgage skipped servicing payments last month, and 16% said they wouldn’t be able to make payments in the future.
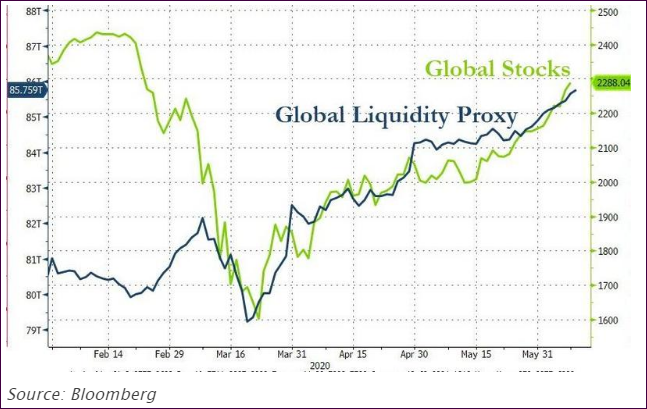
These are the true facts of what is happening in the underlying economy, none of which have been given consideration by the markets, where the relentless addition of liquidity paints a picture totally disengaged from underlying conditions. The open-ended question remains:
“Has recognition finally set in that the economy will not see a V-shape recovery this year as reflected by market levels?”
Author Michael Snyder sees it this way:
Sadly, the truth is that economic conditions will not be returning to normal. Yes, some of the jobs that were lost will be recovered as states start to “reopen” their economies. But more than 100,000 businesses have already permanently closed during this new economic downturn, and all of those jobs are lost forever.
And yes, the level of economic activity will rise as states end their lockdowns, but it will still be much lower than it was before COVID-19 started spreading like wildfire in the United States.
In the end, the markets got thrashed pulling our Domestic Trend Tracking Index (TTI) back below its long-term trendline. A one-day sharp drop could be an outlier and does not necessarily indicate a change in the major trend, but it could.
Only time will tell, but today’s action could very well spell the end of the March 15 rebound and the final bursting of the stock market bubble. Or, it could prompt the Fed to finally “japanify” the US markets via outright purchases of stocks and stock ETFs to keep the bullish dream alive.
Tomorrow will be crucial. I will watch market activity and, should the downward draft continue, I will start liquidating our more volatile holdings and/or those that are triggering their trailing sell stops. As of today, none were prompted.
Read More
