
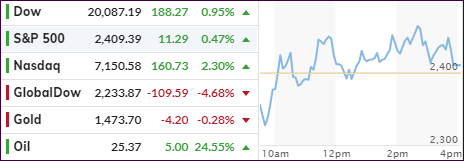
[Chart courtesy of MarketWatch.com]
- Moving the markets
Last night, the futures fluctuated wildly with that theme continuing throughout today’s trading day with the major indexes swinging around their respective moving averages.
It appears that traders tried to figure out the possible consequences of the all-out “kitchen sink” approach by the global central banks. It’s hard to keep track of all their efforts to prop up the markets, but ZH managed to compile this summary:
- Fed announced a new emergency program (MMLF) to aid money markets
- ECB “no limits” bazooka (“Pandemic Purchase Program w/ $820B of QE)
- RBA 25bps cut to ELB, introduces QE and targeted YCC
- Japan discussing $276B packed including “cash payouts” to households
- S Korea new $40B package
- Brazilian 50bps rate cut
- US Senate passes 2nd stimulus bill and negotiating the 3rd ($1.3T)
- Fresh headlines from Bloomberg *GERMANY MAY AUTHORIZE EMERGENCY DEBT AS SOON AS NEXT WEEK
- BOE emergency rate cut to 0.1% and GBP200BN QE expansion
The most recognized one was the ECB’s launch of Bazooka #2, but we’ll have to wait and see if this thing will really produce the desired result, or simply resemble a squirt from a water pistol.
The Fed, on the other hand, has now boosted its daily QE by 66% overnight to a record $75 billion, and that is in ONE day. For comparison, in the “good old days,” QE was less than that in ONE Month.
What this tells me is that the financial plumbing is showing some serious leaks, which means some big players, be it hedge funds or banks, are likely caught on the wrong side of a trade and are in dire straits of a bailout. I am sure we will find out soon who these suspects are.
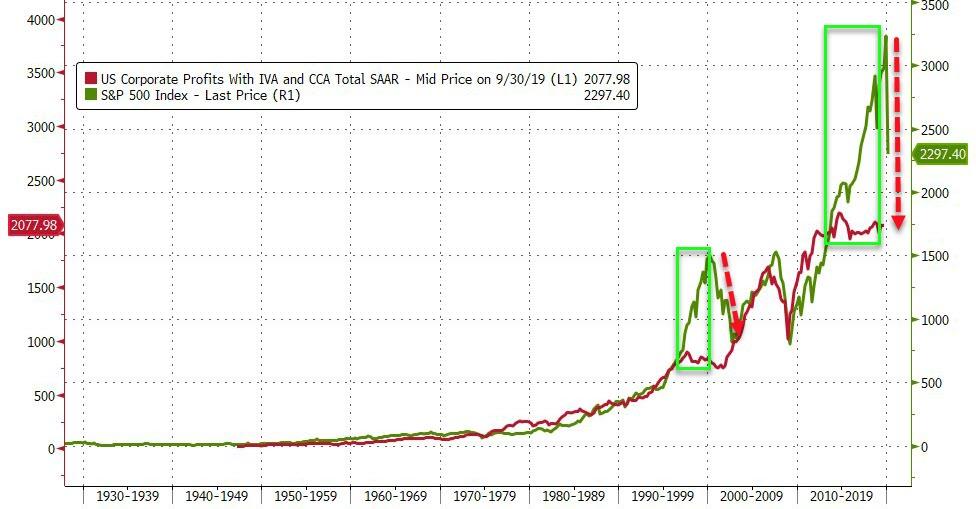
Still, we remain in a bear market for the foreseeable future. While no one knows where the eventual bottom will be, a temporary stopping point in this slide could be once the S&P’s price matches up with reality, AKA US corporate profits, as Bloomberg presents in this chart. For the S&P, that would mean a level of around 1,700, which would be down another 30% from current prices. Ouch!
Looking at the big picture, not only have global markets seen $25 trillion of monopoly money, AKA “paper” wealth, erased over the past 4 weeks, the bear has also annihilated all gains from the December 2018 crash; that is for those in the buy-and-hold community.
In the meantime, the major indexes managed to eke out a small gain with the Nasdaq faring the best with +2.30%, but for the week, the Dow is the worst performer: Down by -13%.
2. ETFs in the Spotlight
In case you missed the announcement and description of this section, you can again.
It features 10 broadly diversified and sector ETFs from my HighVolume list as posted every Saturday. Furthermore, they are screened for the lowest MaxDD% number meaning they have been showing better resistance to temporary sell offs than all others over the past year.
The below table simply demonstrates the magnitude with which some of the ETFs are fluctuating regarding their positions above or below their respective individual trend lines (%+/-M/A). A break below, represented by a negative number, shows weakness, while a break above, represented by a positive percentage, shows strength.
For hundreds of ETF choices, be sure to reference Thursday’s StatSheet.
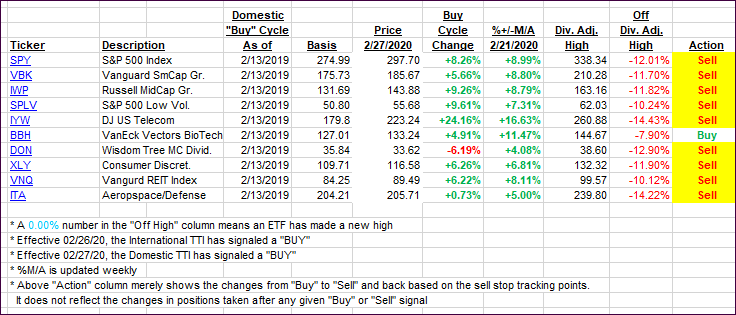
For this past domestic “Buy” cycle, which ended on 2/27/2020, here’s how some our candidates have fared:
Click image to enlarge
Again, the %+/-M/A column above shows the position of the various ETFs in relation to their respective long-term trend lines, while the trailing sell stops are being tracked in the “Off High” column. The “Action” column will signal a “Sell” once the -8% point has been taken out in the “Off High” column. For more volatile sector ETFs, the trigger point is -10%.
3. Trend Tracking Indexes (TTIs)
Our TTIs headed south changed only immaterially, as today’s rebound was less than impressive.
Here’s how we closed 03/19/2020:
Domestic TTI: -27.99% below its M/A (prior close -28.18%)—Sell signal effective 02/27/2020
International TTI: -27.68% below its M/A (prior close -27.95%)—Sell signal effective 02/26/2020
Disclosure: I am obliged to inform you that I, as well as my advisory clients, own some of the ETFs listed in the above table. Furthermore, they do not represent a specific investment recommendation for you, they merely show which ETFs from the universe I track are falling within the specified guidelines.
Contact Ulli