
ETF Tracker StatSheet
You can view the latest version here.
CRASHING INTO THE WEEKEND
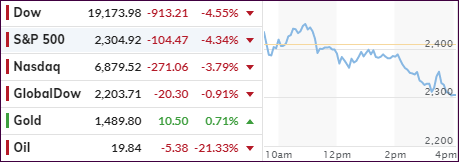
[Chart courtesy of MarketWatch.com]
- Moving the markets
Despite an early bounce along the green side of the unchanged line, reality set in, supported by the always unpredictable quad options expirations day, sending the markets reeling—again.
The major indexes were hammered, with the S&P 500 getting skunked by -15%—for the week! Not helping matters late in the day was the fact that a death-cross in the Dow had occurred, meaning its 50-day moving average had dropped below its 200-day M/A, which can be a sign of more weakness ahead.
Of course, some clueless analysts were quick to point out that the last death cross appeared three days before the Christmas Eve 2018 bottom. So, what difference does that make? All the gains from that point forward have now been given back and then some, which is a clear representation of the buy-and-hold idiocy.
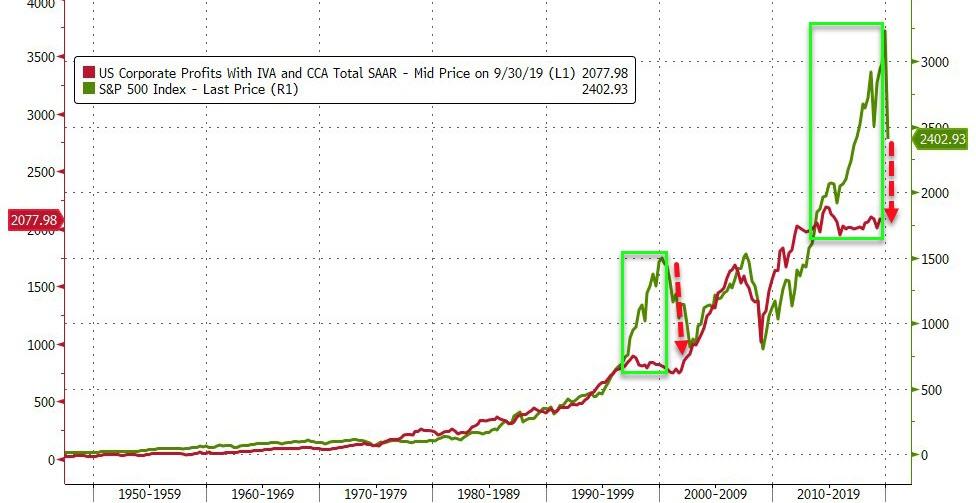
ZH points to the fact that today was a historic one. The Fed bought a record $107 billion in securities today alone, as its balance sheet exploded some 50% in the last six months. It becomes clearer by the day that the Fed’s scramble to stabilize the Treasury market is not working.
As I said before, there is some big player (to be named later), like a bank or Hedge fund, that got caught on the wrong side of a severely leveraged trade and needs to be bailed out. Hence the monetization of various securities, including now the Muni bond market. Something appears to be broken beyond repair, and I am sure we will find out soon what it is.
ZH added more color:
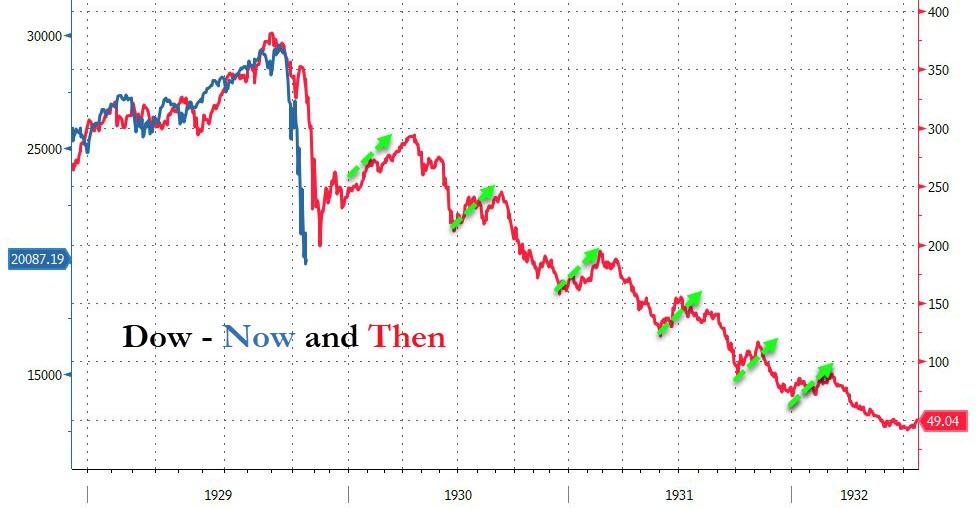
This was the worst week since Lehman (and worst 4 weeks since Nov 1929) for The Dow Jones Industrial Average…(Dow was down 18% during the Lehman week and 17.35% this week), despite The Fed gushing a stunning $307 billion into the markets – almost double its previous biggest liquidity injection (in March 2009)…
And here’s Bloomberg’s updated chart showing where we might be going, and that is towards the 1,700 level on the S&P 500. And longer term, we may even see history repeat itself.
In the meantime, enjoy the popcorn while watching this movie from the sidelines.
2. ETFs in the Spotlight
In case you missed the announcement and description of this section, you can again.
It features 10 broadly diversified and sector ETFs from my HighVolume list as posted every Saturday. Furthermore, they are screened for the lowest MaxDD% number meaning they have been showing better resistance to temporary sell offs than all others over the past year.
The below table simply demonstrates the magnitude with which some of the ETFs are fluctuating regarding their positions above or below their respective individual trend lines (%+/-M/A). A break below, represented by a negative number, shows weakness, while a break above, represented by a positive percentage, shows strength.
For hundreds of ETF choices, be sure to reference Thursday’s StatSheet.
For this past domestic “Buy” cycle, which ended on 2/27/2020, here’s how some our candidates have fared:
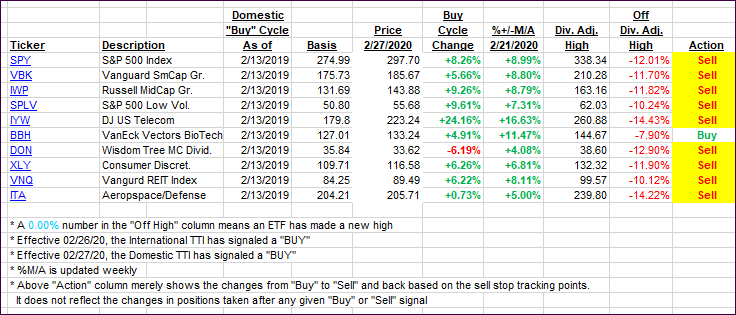
Click image to enlarge
Again, the %+/-M/A column above shows the position of the various ETFs in relation to their respective long-term trend lines, while the trailing sell stops are being tracked in the “Off High” column. The “Action” column will signal a “Sell” once the -8% point has been taken out in the “Off High” column. For more volatile sector ETFs, the trigger point is -10%.
3. Trend Tracking Indexes (TTIs)
Our TTIs slipped deeper into bear market territory as the markets crashed into the weekend.
Here’s how we closed 03/20/2020:
Domestic TTI: -30.98% below its M/A (prior close -28.18%)—Sell signal effective 02/27/2020
International TTI: -28.11% below its M/A (prior close -27.95%)—Sell signal effective 02/26/2020
Disclosure: I am obliged to inform you that I, as well as my advisory clients, own some of the ETFs listed in the above table. Furthermore, they do not represent a specific investment recommendation for you, they merely show which ETFs from the universe I track are falling within the specified guidelines.
———————————————————-
WOULD YOU LIKE TO HAVE YOUR INVESTMENTS PROFESSIONALLY MANAGED?
Do you have the time to follow our investment plans yourself? If you are a busy professional who would like to have his portfolio managed using our methodology, please contact me directly or get more details here.
———————————————————
Back issues of the ETF Tracker are available on the web.
Contact Ulli