Below, please find the latest High-Volume ETF Cutline
report, which shows how far above or below their respective long-term trend
lines (39-week SMA) my currently tracked ETFs are positioned.
This report covers the HV ETF Master List from Thursday’s
StatSheet and includes 322 High Volume ETFs, defined as those with an average
daily volume of more than $5 million, of which currently 283 (last week 284)
are hovering in bullish territory. The yellow line separates those ETFs that
are positioned above their trend line (%M/A) from those that have dropped below
it.
The
major indexes continued their upward trend, slow and steady, as we’ve seen all
week, which is preferable over fast and furious moves followed by quick and
sharp corrections.
Today’s
melt up was in part caused by quadruple options expirations creating more
volatility than we’ve seen during the recent past. You could say that the options
market “tail” was wagging the US equity market “dog” once again as ZH quipped.
While
not earthshattering but market pleasing, was the final Q3 GDP revision, which remained
unchanged at 2.1% and represents a fractional rise from the 2% in Q2.
The
always present fears of a potential downward adjustment have now been
alleviated, which contributed to market stability. Also helping the indexes
push higher was a report that Personal Incomes, after a slowdown in October, grew
at the fastest pace of 2019, while spending accelerated as well.
Mixed
news came from the “Retailpocalypse” with data showing that so far 9,300 stores
have closed across the US in 2019, which is a 59% increase over 2018. This clearly
represents a change of the times we are living in, during which the physical
department stores are only of limited value for shoppers with the many online options
being the preferred mode of operation. Sad or not, it is a fact.
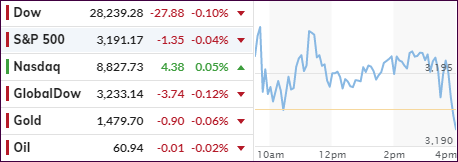
In
the end, the major indexes touched record intraday highs before fading into the
close. This Friday marks the fourth straight week of gains with the S&P 500
adding +1.6% over the past 5 trading days. Right now, the bull
looks to be alive and well, while the bears seemed to have gone into hibernation—at
least for the moment.
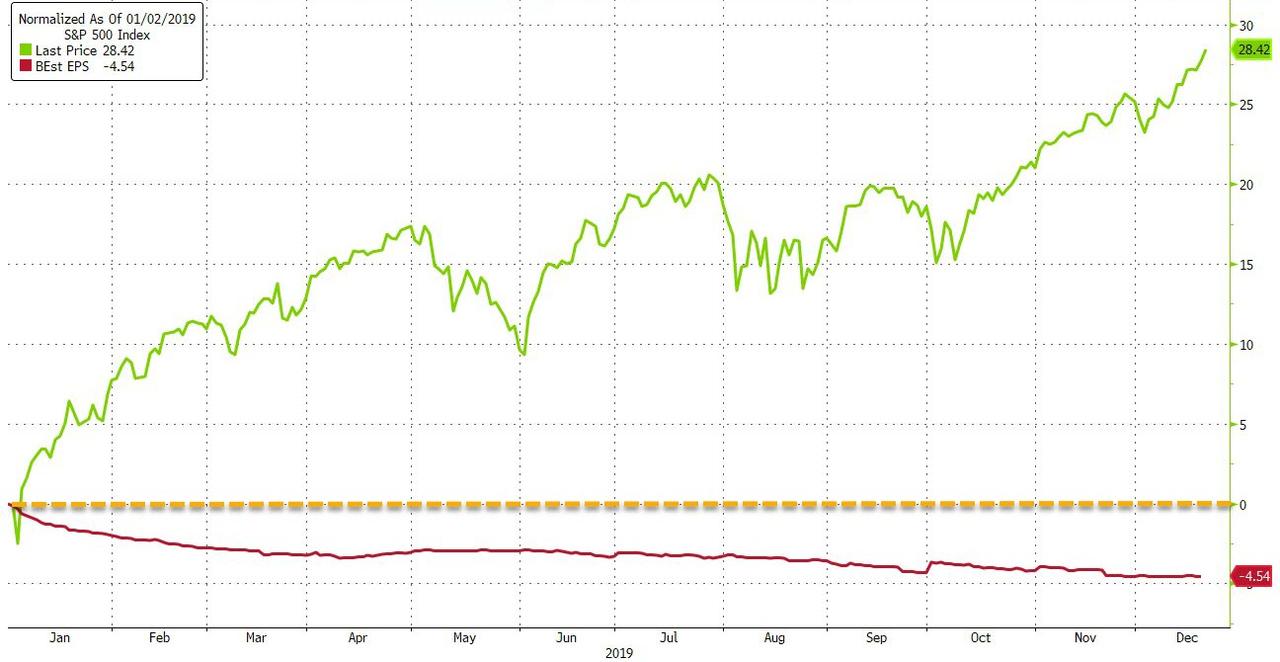
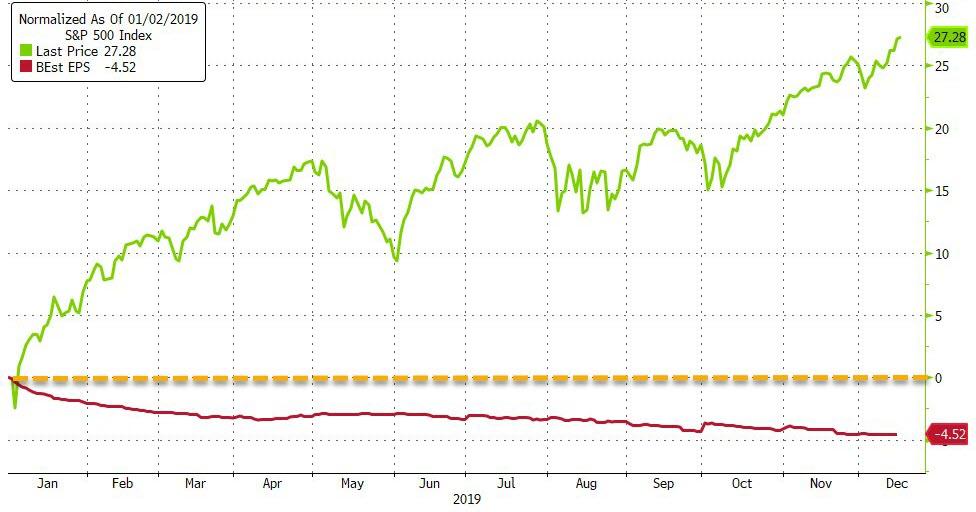
Why
is that? You should know by now, that the driver of this relentless melt up has
been and remains global
liquidity, as this chart from Bloomberg shows. Otherwise, how would it be
possible for the S&P to have gained so substantially this year, while earnings
expectations have slid almost 5%?
ETF Data
updated through Thursday, December 19, 2019
Methodology/Use of this StatSheet:
1. From the universe of over 1,800 ETFs, I have selected only those with a
trading volume of over $5 million per day (HV ETFs), so that liquidity and a
small bid/ask spread are assured.
2. Trend Tracking Indexes (TTIs)
Buy or Sell decisions for Domestic and International ETFs (section 1 and
2), are made based on the respective TTI and its position either above or below
its long-term M/A (Moving Average). A crossing of the trend line from below
accompanied by some staying power above constitutes a “Buy” signal. Conversely,
a clear break below the line constitutes a “Sell” signal. Additionally, I use a
7.5% trailing stop loss on all positions in these categories to control
downside risk.
3. All other investment arenas do not have a TTI and should be traded
based on the position of the individual
ETF relative to its own respective trend line (%M/A). That’s why those signals
are referred to as a “Selective Buy.” In other words, if an ETF crosses its own
trendline to the upside, a “Buy” signal is generated. Since these areas tend to
be more volatile, I recommend a wider trailing sell stop of 7.5% -10% depending
on your risk tolerance.
If you are unfamiliar with some of the terminology, please see Glossary of Termsand new subscriber information in section 9.
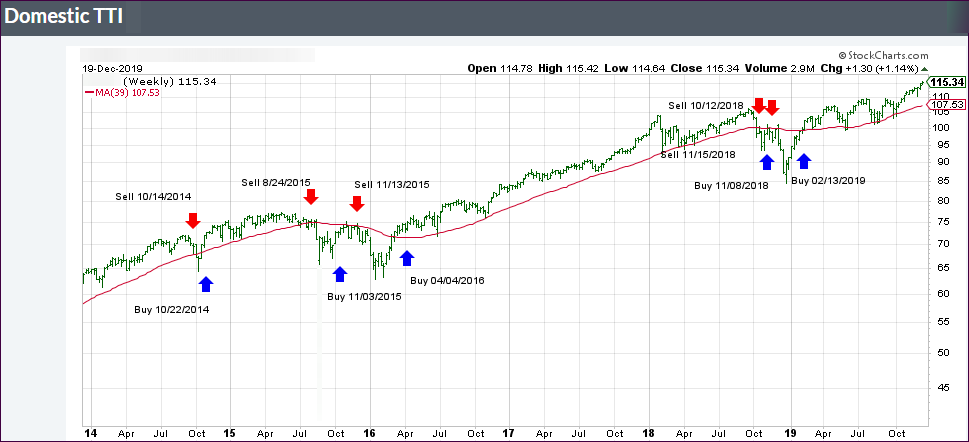
1. DOMESTIC EQUITY ETFs: BUY
— since 02/13/2019
Click on chart to enlarge
Our main directional indicator, the Domestic Trend Tracking Index (TTI-green line in the above chart) is now positioned above its long-term trend line (red) by +7.61% after having generated a new Domestic “Buy” signal effective 2/13/19 as posted.
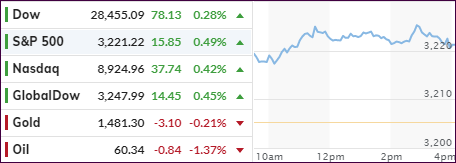
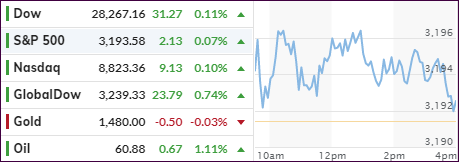
The major
indexes set new closing records, unimpressed by the ongoing impeachment saga,
the result of which has been simply brushed aside.
Market
concerns are virtually non-existent, since the Republican-controlled Senate will
be the final judge with expectations being that they will vote against having
Trump removed from office.
In other
words, from a market perspective, the impeachment is meaningless and a non-event.
Positive
vibes, that the US-China trade “truce” will hold, continues to lend support to
equities with traders considering recent economic data points as temporarily stabilized.
Even
today’s Existing Home Sales Report, showing an unexpected tumble in November,
could not shatter confidence.
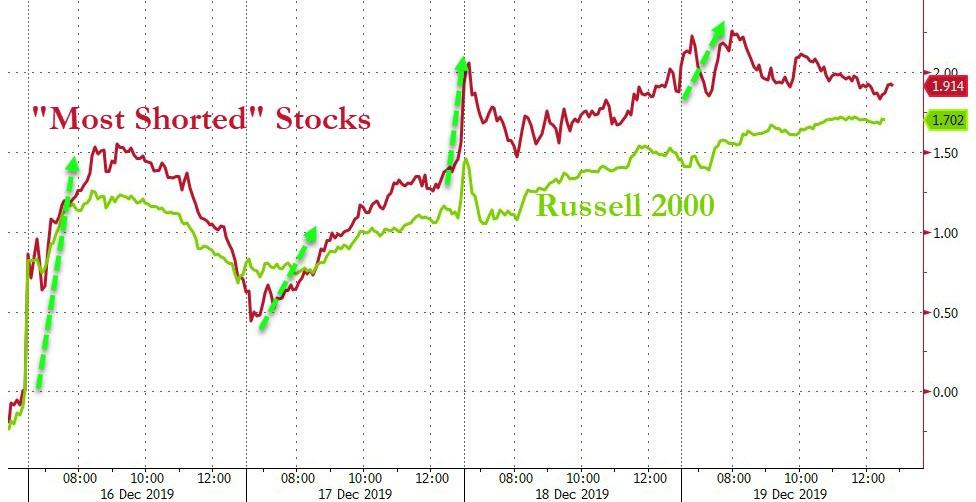
Of course,
the ongoing short squeezes gave an assist to the bullish theme, as they have done
for the past 4 days straight, even though today we only saw an opening and
closing ramp, as Bloomberg’s chart
shows.
On deck
for tomorrow is options expiration day, which can cause more market fluctuations
than normal, but it’s unlikely it will have any effect on the major trend.
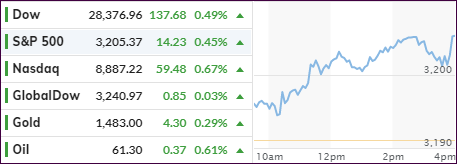
The markets started this Wednesday by inching higher with
traders looking to keep a 5-day winning streak alive. Supporting this optimism
was the firm belief that the preliminary US-China trade agreement was a done
deal, despite some nervousness as to when it would be signed. However, the lack
of news to the contrary, was a positive.
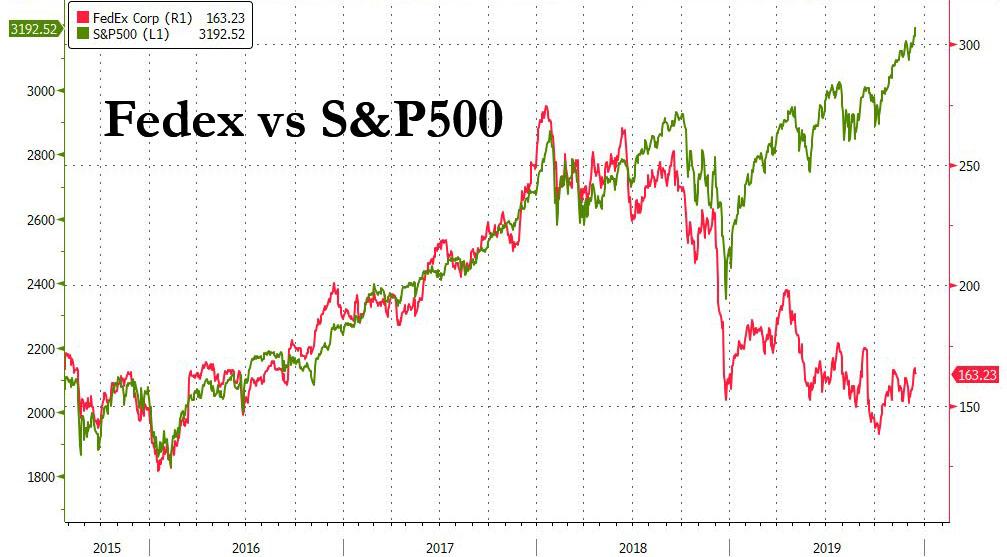
Also lending an assist were waning concerns about the
global economic outlook. Although yesterday’s US econ numbers painted an
improving picture, except for FedEx, which reported disastrous earnings while
slashing guidance. This clearly shows the disconnect
between the market and the economy.
The situation remains questionable at best, especially
when viewing Eurozone data. After all, pushing interest rates into negative
territory, and keeping them there, is not a sign of economic strength; in fact,
it is exactly the opposite.
However, stocks remain backed by the Fed stepping in and
providing liquidity to get a handle on the unraveling of interest rates in the overnight
repo market, which started in September. While this crisis is far from being
over, traders and computer algos are simply ignoring it for now—that is until
that day arrives when even more emergency stimulus is needed.
In the meantime, the major indexes managed to meander higher,
while enjoying another session in record territory, even though they faded into
the close.
The major indexes opened to the upside, pulled back but
managed to bounce around the remainder of the session and, in the end, eked out
another green close, although a small one.
The main supporting cast today included positive economic
data with manufacturing rebounding and single-family building permits reaching a
12-year high. Job openings rose from October but hiring tumbled.
Good economic news pales in its impact on the stock market
compared to headlines about US-China trade talks or the Fed’s spiking the punch
bowl via lower rates or more QE. None of that was in the news today, so it was up
Trump to keep the good times rolling by focusing on the Fed and tweeting:
“Would be sooo great if the Fed would further
lower interest rates and quantitative ease.”
“The Dollar is very strong against other
currencies and there is almost no inflation. This is the time to do it. Exports
would zoom!“
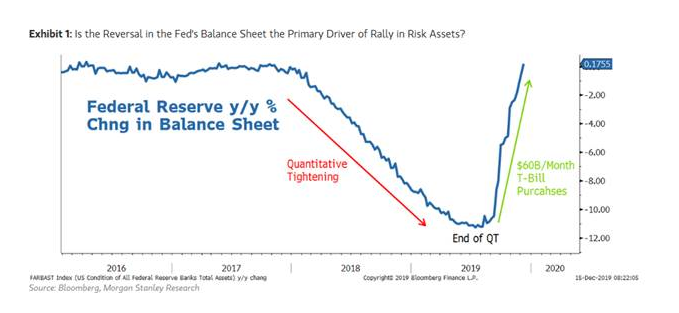
As ZH, pointed out, what about the fact that the dollar
has tumbled since the Phase One deal was completed? And the Fed is printing
money at its fastest pace since the financial crisis, as this
chart shows.
Looks to me that they have been more than compliant with
Trump’s wishes, whether you agree with the policy or not.
Be that as it may, it looks like the bulls will keep
running despite earnings
expectations being in retreat mode.
