Below, please find the latest High-Volume ETF Cutline report, which shows how far above or below their respective long-term trend lines (39-week SMA) my currently tracked ETFs are positioned.
This report covers the HV ETF Master List from Thursday’s StatSheet and includes 312 High Volume ETFs, defined as those with an average daily volume of more than $5 million, of which currently 264 (last week 265) are hovering in bullish territory. The yellow line separates those ETFs that are positioned above their trend line (%M/A) from those that have dropped below it.
In case you are not familiar with some of the terminology used in the reports, please read the Glossary of Terms. If you missed the original post about the Cutline approach, you can read it here.
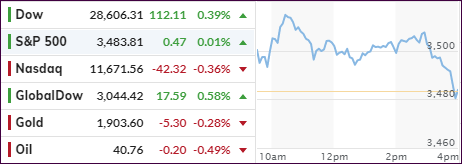
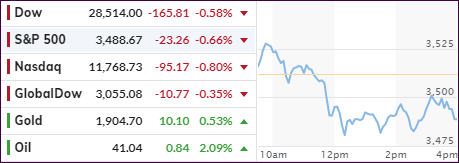
An early rally hit the skids with the major indexes diving into the close with only the Dow showing a small gain of +0.39%. The Nasdaq fared the worst by giving back -0.36%, but for the week, equities eked out a small profit.
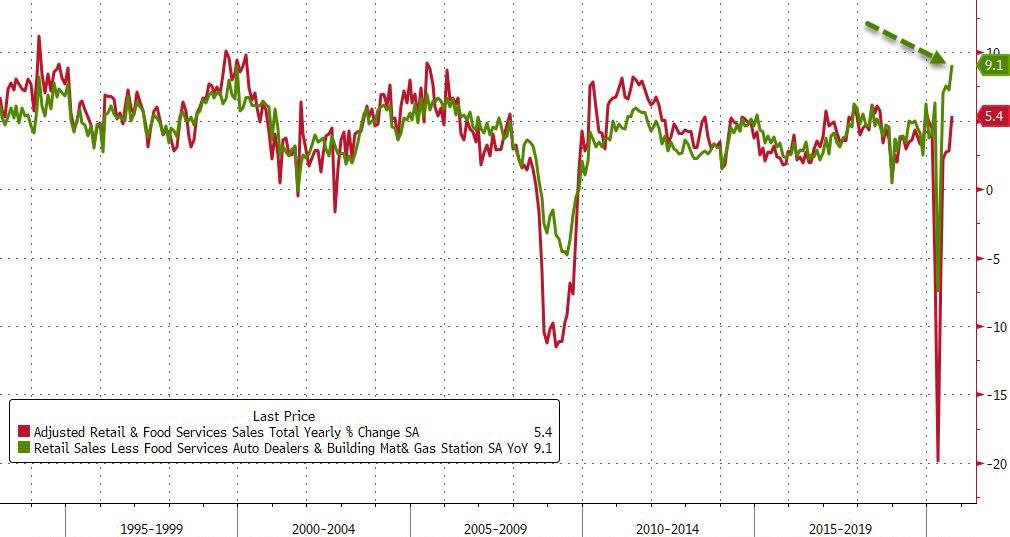
Helping the Dow snap a 3-day losing streak was a report showing that US Core Retail Sales surged by the most in history, according to ZH. After two straight months of disappointments, September turned out to be the shining star by showing a rise of 1.9% MoM vs. expectations of a meager 0.8%. This translates into a stunning YoY 9.1%, which was the greatest rise ever.
Of course, all that occurred with government handouts in full swing, so we need to see what happens in October, when those “assists” came to an end…
“The economy continues to show pockets of strength, but those pockets need to widen,” said Quincy Krosby, chief market strategist at Prudential Financial. “For those who still have their jobs, the economy has been healing.”
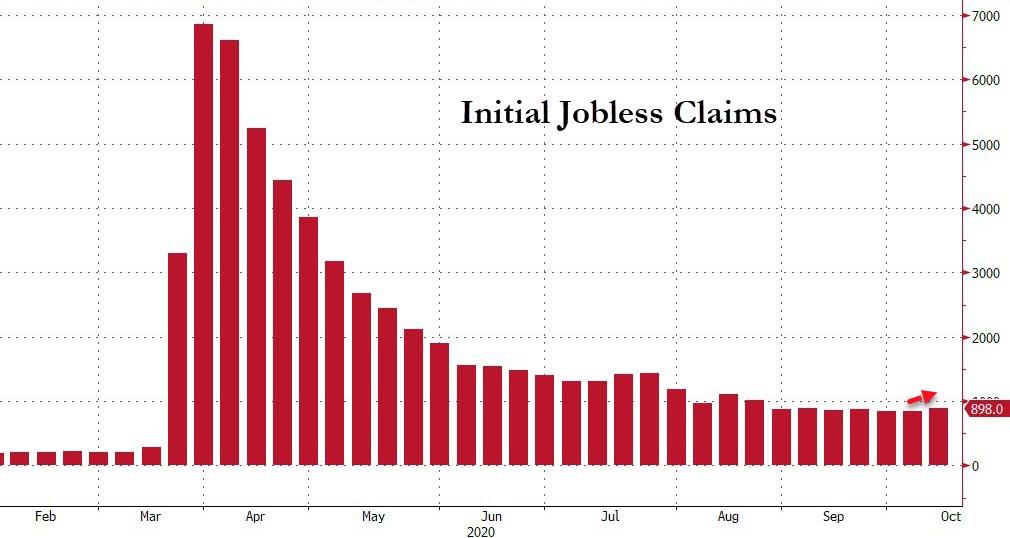
“The question is, if initial unemployment claims continue to rise, will we continue to see retail sales surprising to the upside,” Krosby added.
Regarding the stimulus saga, the signals continue to be mixed with no commitment in sight from either warring party. Although Treasury Secretary Mnuchin indicated that the White House will not derail the stimulus talks with the opposition.
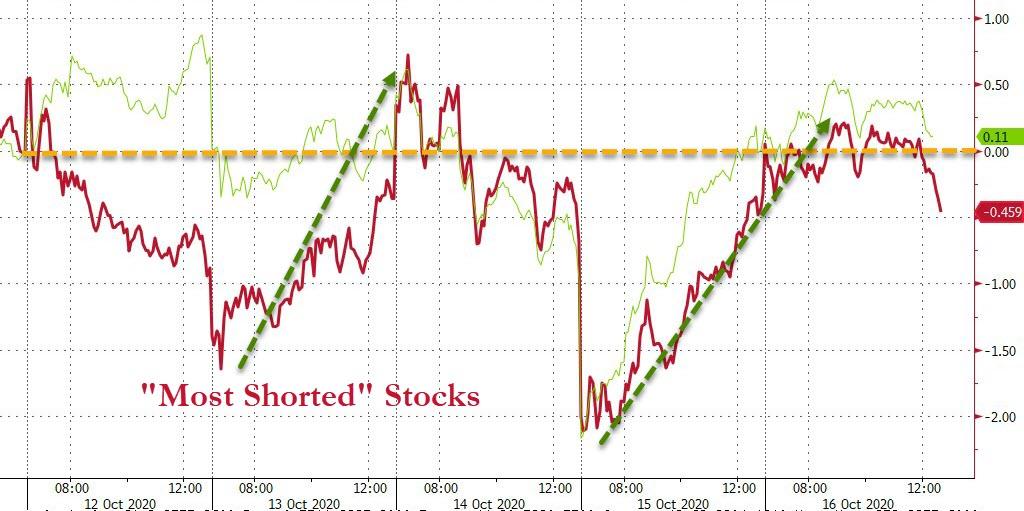
While yesterday’s short squeeze continued early in the session, it lost steam late in the day thereby causing the sell-off during the last hour.
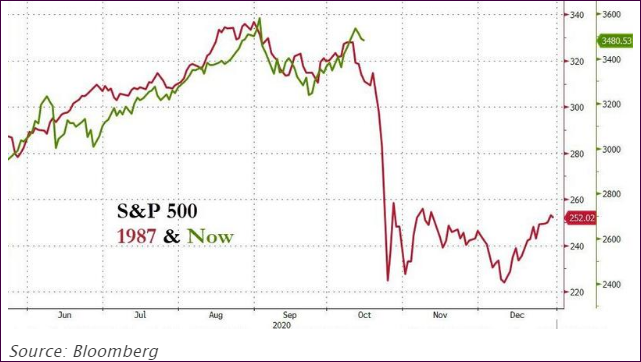
This coming Monday, October 19, marks the 33rd anniversary of the 1987 Black Monday market crash. The analog to the 1987 event is pretty much intact, as you can see in Bloomberg’s chart:
I am not forecasting that we will see a repeat, but you must admit that the similarities leading up to the “event” are striking.
ETF Data updated through Thursday, October 15, 2020
Methodology/Use of this StatSheet:
1. From the universe of over 1,800 ETFs, I have selected only those with a trading volume of over $5 million per day (HV ETFs), so that liquidity and a small bid/ask spread are assured.
2. Trend Tracking Indexes (TTIs)
Buy or Sell decisions for Domestic and International ETFs (section 1 and 2), are made based on the respective TTI and its position either above or below its long-term M/A (Moving Average). A crossing of the trend line from below accompanied by some staying power above constitutes a “Buy” signal. Conversely, a clear break below the line constitutes a “Sell” signal. Additionally, I use a 7.5% trailing stop loss on all positions in these categories to control downside risk.
3. All other investment arenas do not have a TTI and should be traded based on the position of the individual ETF relative to its own respective trend line (%M/A). That’s why those signals are referred to as a “Selective Buy.” In other words, if an ETF crosses its own trendline to the upside, a “Buy” signal is generated. Since these areas tend to be more volatile, I recommend a wider trailing sell stop of 7.5% -10% depending on your risk tolerance.
If you are unfamiliar with some of the terminology, please see Glossary of Termsand new subscriber information in section 9.
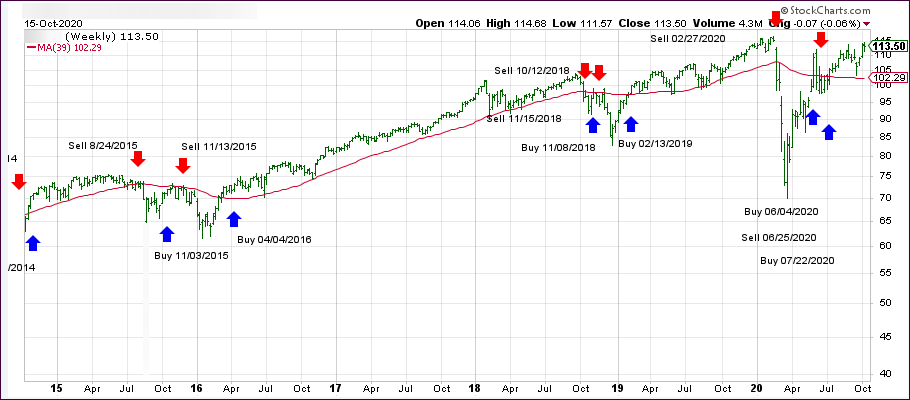
1. DOMESTIC EQUITY ETFs: BUY— since 07/22/2020
Click on chart to enlarge
Our main directional indicator, the Domestic Trend Tracking Index (TTI-green line in the above chart) has now rallied above its long-term trend line (red) by +10.88% and remains in “BUY” mode as posted.
The markets took a steep dive right after the opening, with the Dow down some 300 points, after which a slow but choppy ascent pulled major indexes out of the doldrums, but they fell short of reclaiming their respective unchanged lines.
The culprits for the early weakness were the same as yesterday, namely no progress among the warring parties regarding the stimulus package and renewed threats of lockdowns in those areas with most of the new Covid-19 cases.
Reported CNBC:
“Market volatility is set to continue in the weeks ahead as investors brace for a host of uncertainties—the timing of vaccine availability (after a setback for Johnson & Johnson), the size and timing of additional US fiscal stimulus, and the election outcome,” wrote Mark Haefele, chief investment officer of global wealth management at UBS. “The uneven recovery in the US economy also adds to investor concerns as the results season kicked off this week.”
Headlines were in chaos mode adding to market uncertainty. Here are a few I came across:
WHO Europe Director Says Governments Should Stop Enforcing Lockdowns
European governments reinstate pandemic restrictions to curb a second wave of the coronavirus.
Behind The Nasdaq Weakness: Goldman Downgrades Tech To Neutral
Twitter, Facebook Go Full Tilt Protecting Biden Just Weeks After Execs Join Transition Team
Senate Judiciary To Subpoena Jack Dorsey After Twitter Suspends Trump Campaign, House GOP Accounts Over Biden Scandal
Traders Rattled After Morgan Stanley Sees 80% Odds Result Won’t Be Determined On Election Night
Not helping was the jobless claims report showing that almost 900k Americans filed for first-time benefits last week, which was worse than the 825k expected.
But that’s only part of it with ZH adding this important fact:
So, that’s the reported data – do with it what you will, depending on your agenda – but bear in mind that it is practically useless noise given the fact that issues with data from California, the most populous state, continue to remain frozen as they deal with the massive fraud that permeated their unemployment rolls.
I believe that volatility will ramp up over the next few weeks, which is why I took the opportunity to ease up on our market exposure by liquidating one of our holdings to lock in profits before they might turn into losses.
I think a more measured approach in this highly uncertain environment is advisable. After all, I see the downside risk as a graver danger as opposed to a couple percentage points of gains to be made on the upside—at least for the next 3 weeks.
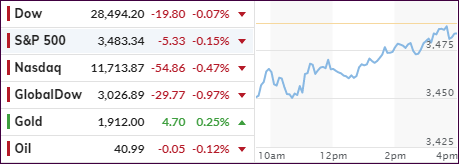
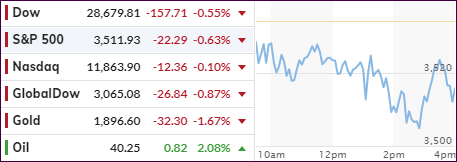
Even though the markets started the session on the plus side, early enthusiasm waned, and the major indexes closed in the red for the second day in a row. The losses were modest, and a late day rebound attempt failed to push equities back above the unchanged line.
Weakness appeared to accelerate after Treasury Secretary Mnuchin threw cold water on hopes of a coronavirus stimulus deal being reached prior to the elections.
Added CNBC:
Mnuchin said around midday that getting a deal done before the election would be difficult, adding that both sides were still far apart on certain issues. He also noted, however, that Democrats and Republicans are making progress in some areas.
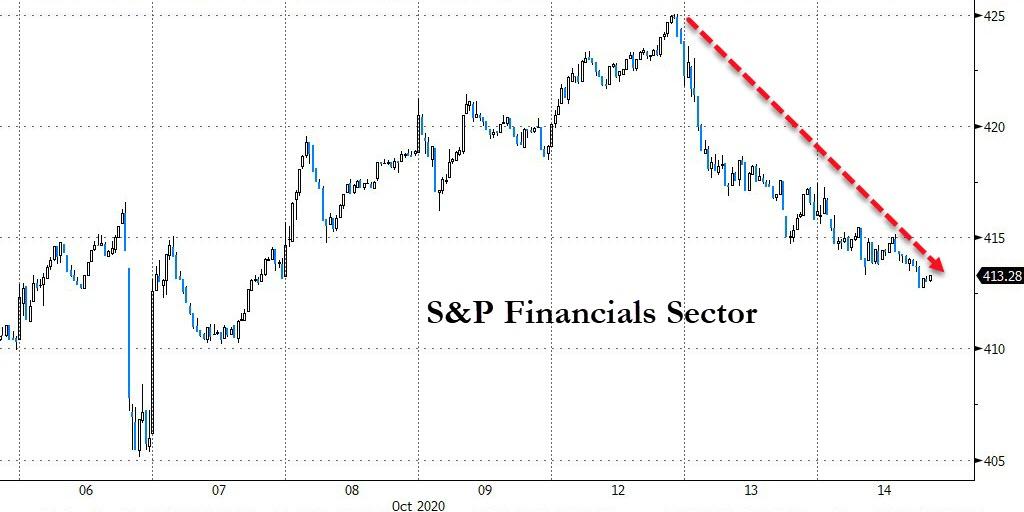
The latest earnings reports turned out ok with Goldman Sachs beating expectations, while BofA’s report cart received mixed reviews sending the financial sector south, as Bloomberg shows here.
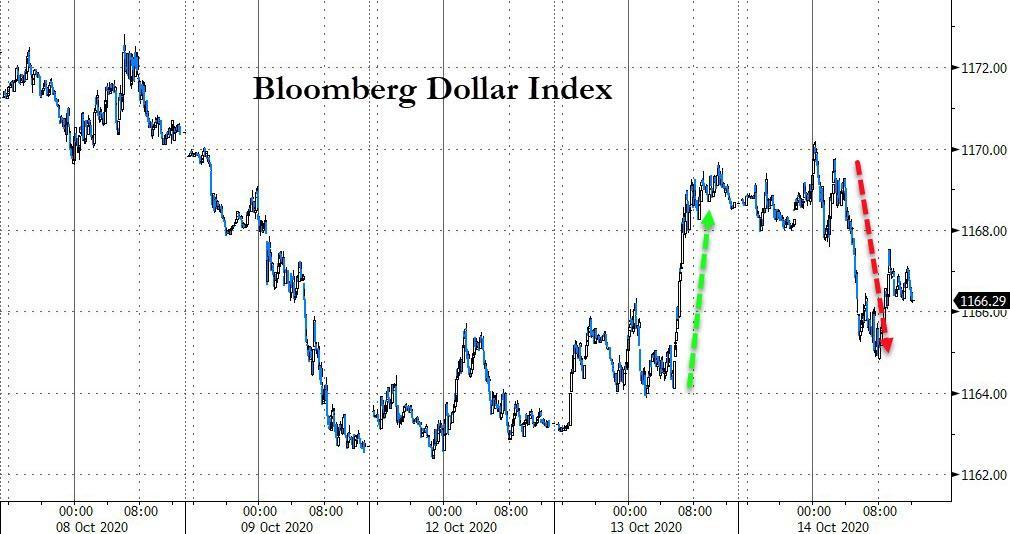
The US Dollar index did an about face and dropped, thereby giving gold a reason to rally with the precious metal gaining +0.53%.
The overall feeling in the markets seems to be one of uncertainty with a “let’s wait and see” attitude prevailing in both bullish and bearish camps.
However, analyst Sven Henrich was spot is with this observation:
The bull case: Nothing matters.
Not debt, not growth, not earnings, not layoffs, not valuations, not forward multiples, not tax hikes.
Keep buying historic valuations because the magic money fairy will keep bailing us out.
Equities headed south right after the opening bell with the Dow ending its 4-day win streak. Bringing the recent rally to a halt was news that several pharmaceutical companies were facing challenges with their Covid-19 vaccines due to side effects causing 2 companies to pause its trials.
Earnings season got started with banking giant JP Morgan delivering better-than-expected earnings but slightly weaker than expected revenues. One of the items that made me go “Hmm…” was their reduction in loan loss provisions, which dropped by 90%. As if potential future loan losses no longer are of any concern…
Also not helping the mood on Wall Street were the stalled talks in Congress with another coronavirus stimulus package questionable, as the warring parties appear in no mood for any concessions.
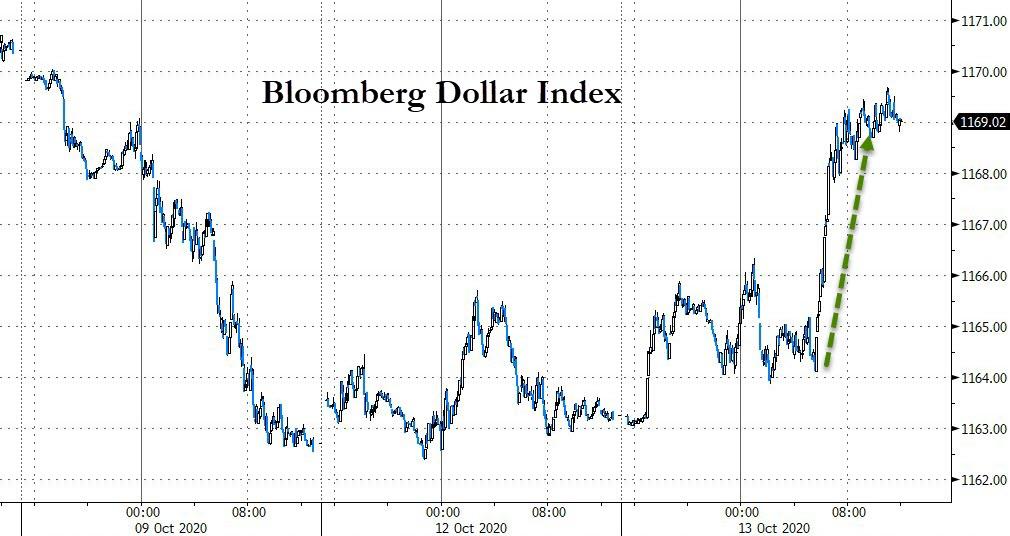
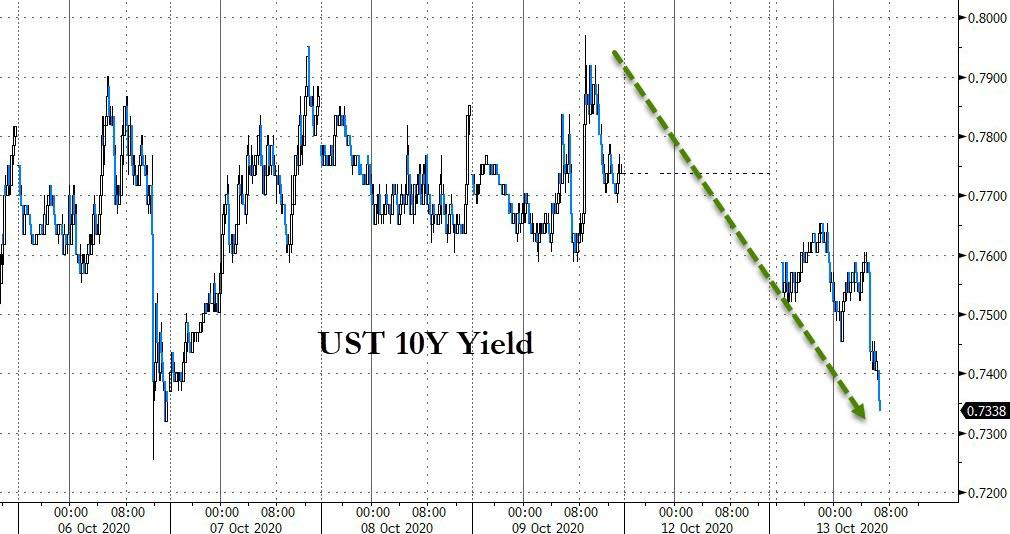
Precious metals got hammered today as the dollar spiked with gold trying to hang on to its $1,900 level, while bonds rallied as yields fell.
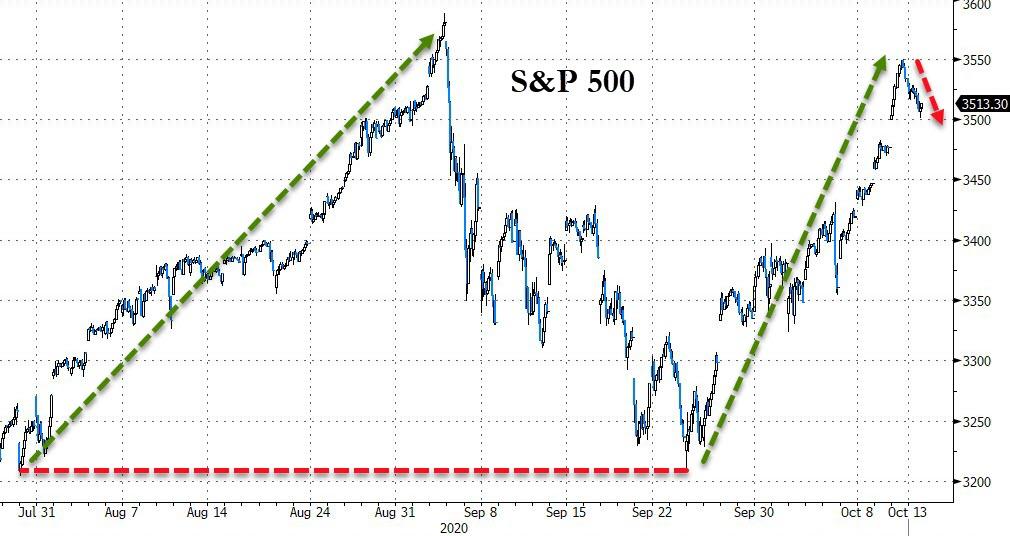
The Nasdaq fared the best among the major indexes, while the S&P 500 was unable to keep recent upward momentum going and therefore failed to take out its recent highs.
In the end, it was a whipsaw day with nothing gained but not much lost either.

