
ETF Tracker StatSheet
You can view the latest version here.
AIMLESS MEANDERING
- Moving the markets
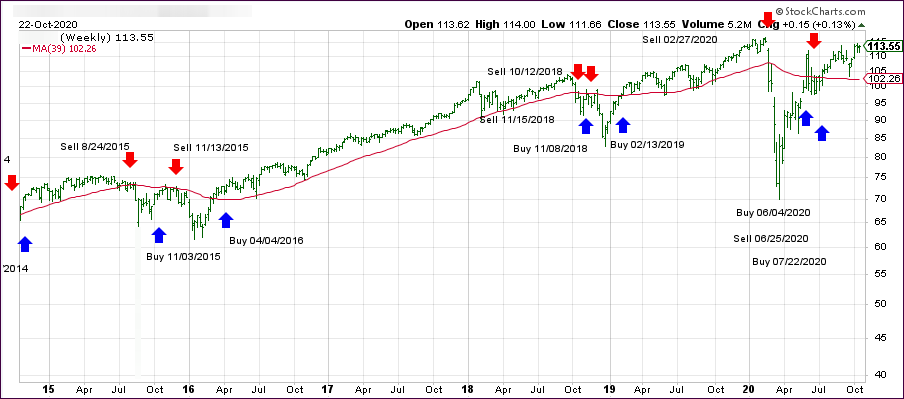
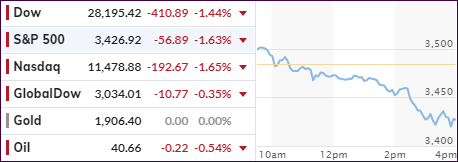
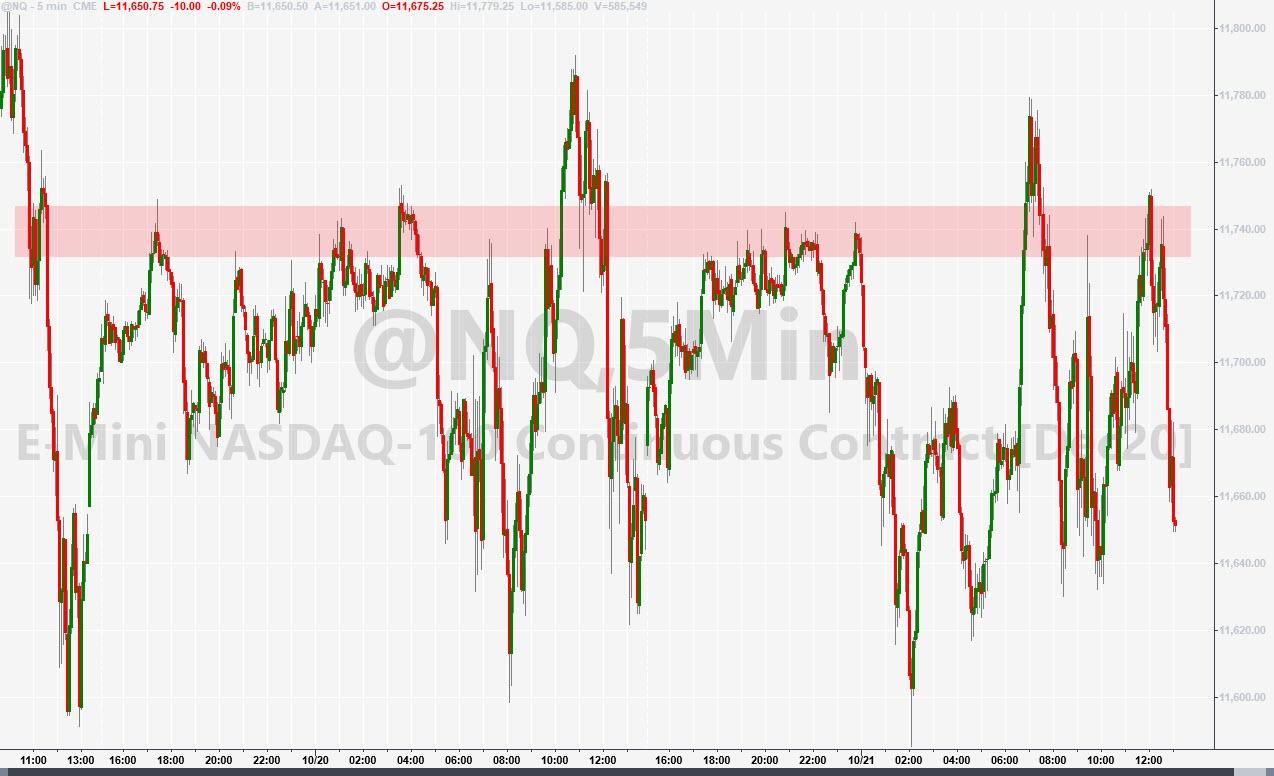
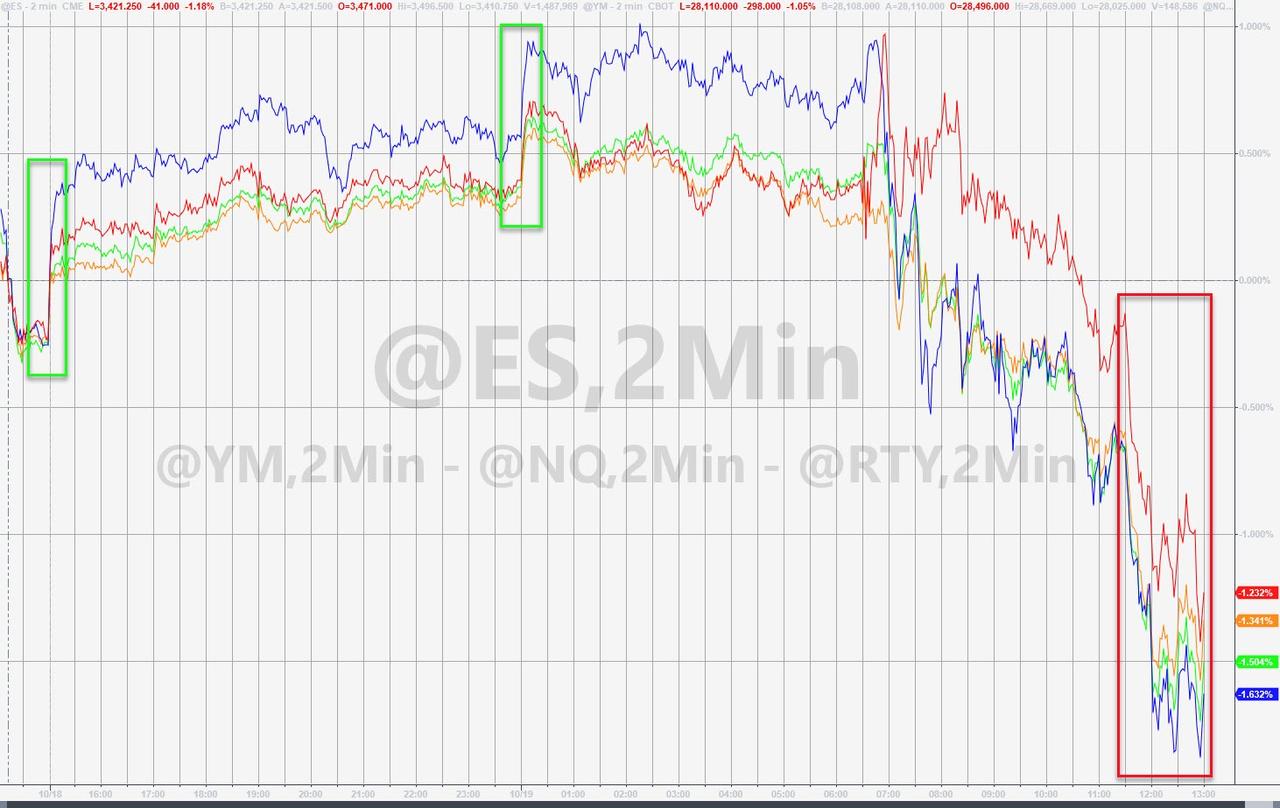
While the chart above shows a nice rebound for the S&P 500 off its mid-day lows, keep in mind that today’s activity happened within a very narrow trading range of less than 1%.
Traders were not willing to commit one way or the other and neither did the computer algos. This theme of going nowhere fast was present throughout the week with the end effect being a minor loss of some -0.5% for the index.
Of course, this lack of action was the result of the fallout from the no stimulus deal, despite both parties trying to keep the dream alive with entertaining quotes like “work hard,” “bill can be passed,” “back and forth” and “not budging one inch.”
“I think everyone is in wait-and-see mode,” said Mike Katz, partner at Seven Points Capital. “There’s a lot of back and forth on stimulus and every headline makes the market move a little bit, but there’s no follow-through because we don’t have a clear picture on that front.”
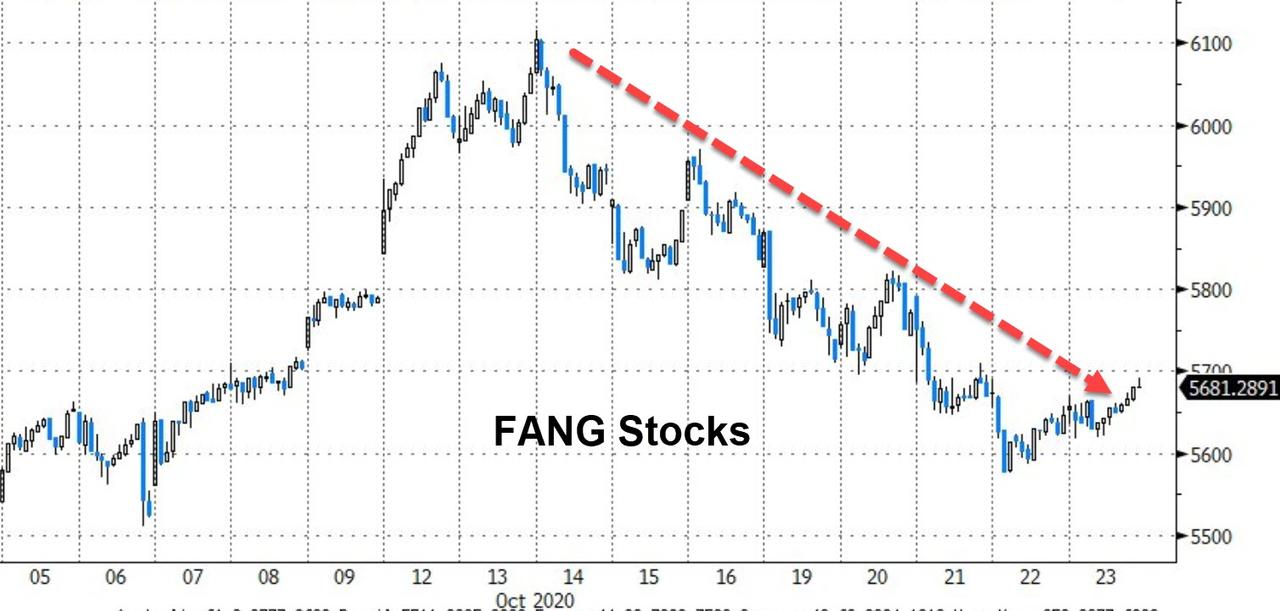
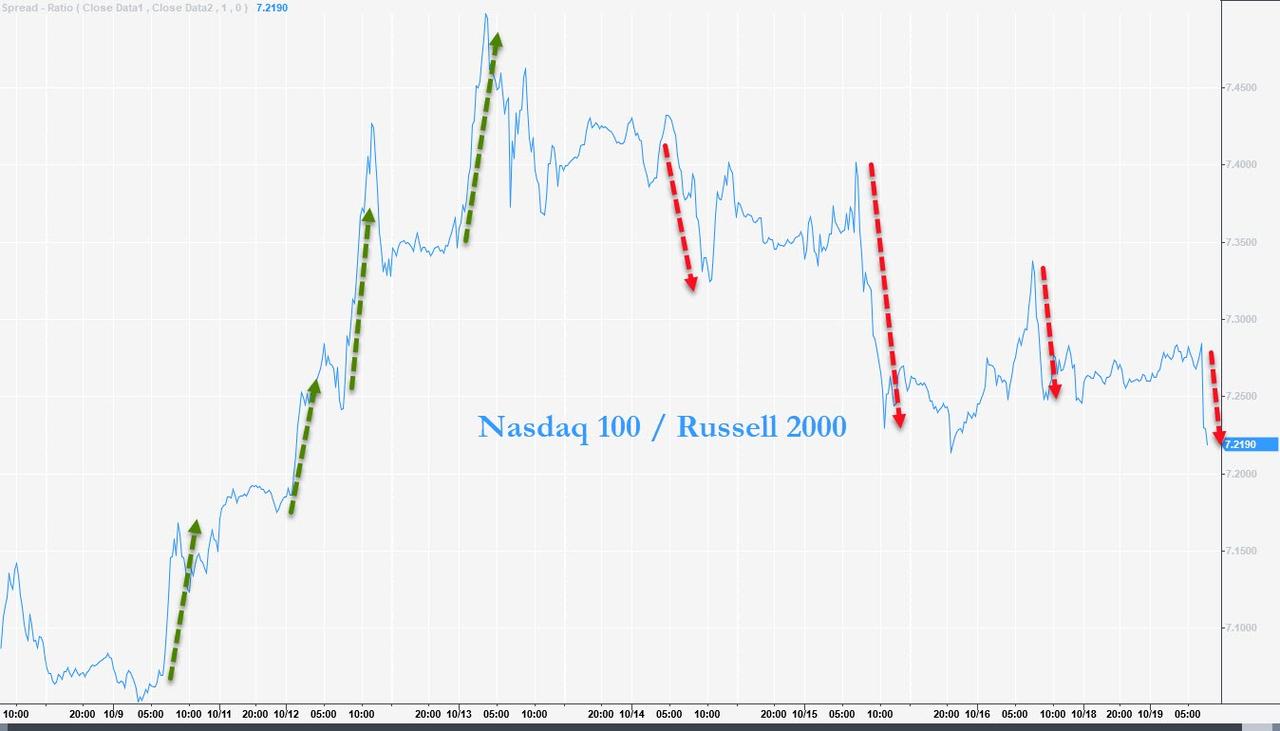
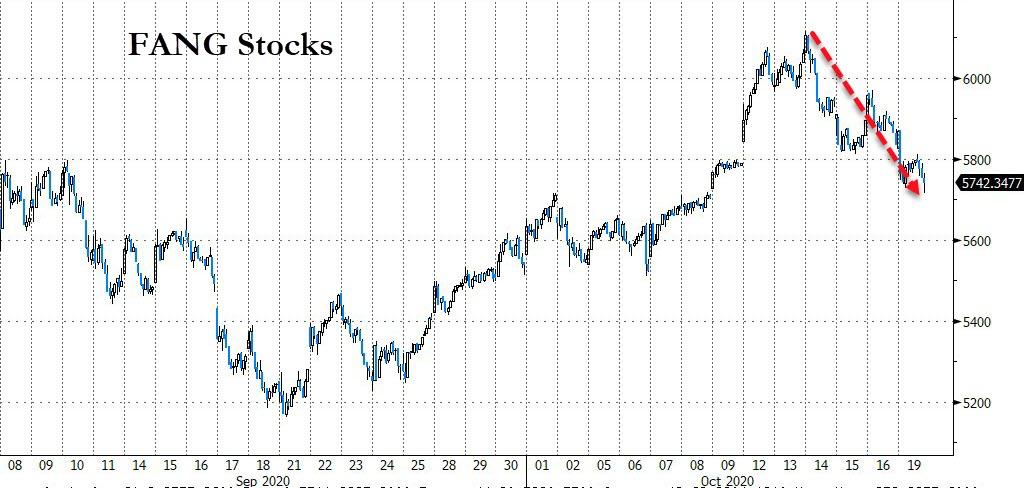
On the earnings side, Intel got hammered with its share price losing over 10% on mixed quarterly numbers. Overall, the tech sector fell over 2% on concerns that a Democratic sweep could lead to higher taxes and tougher regulations.
ZH summed up the week like this:
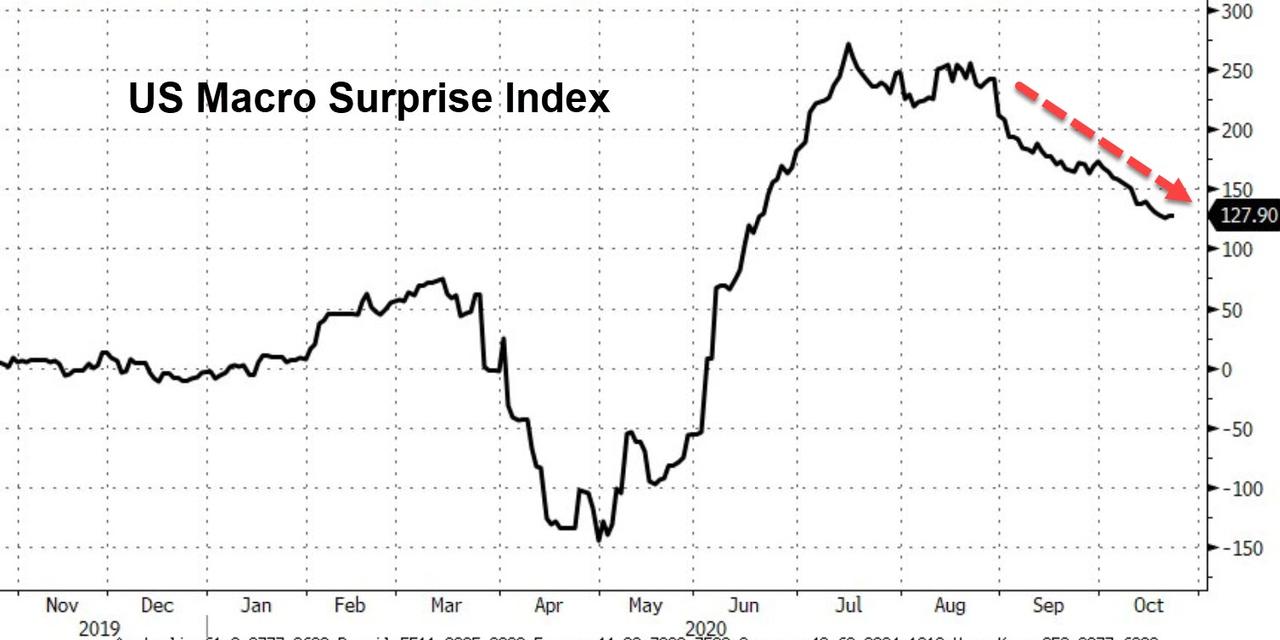
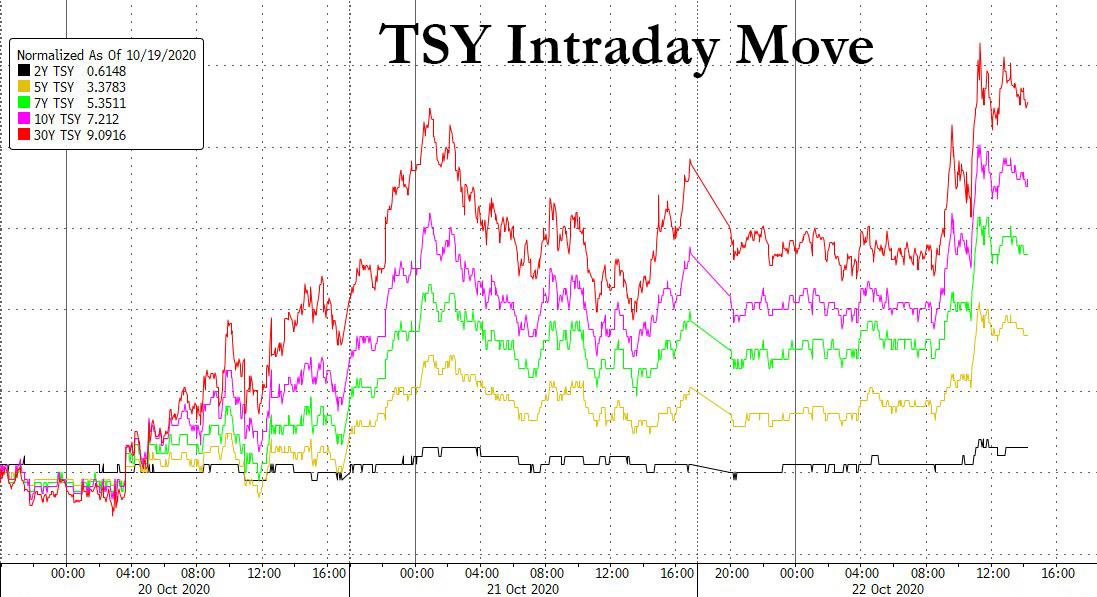
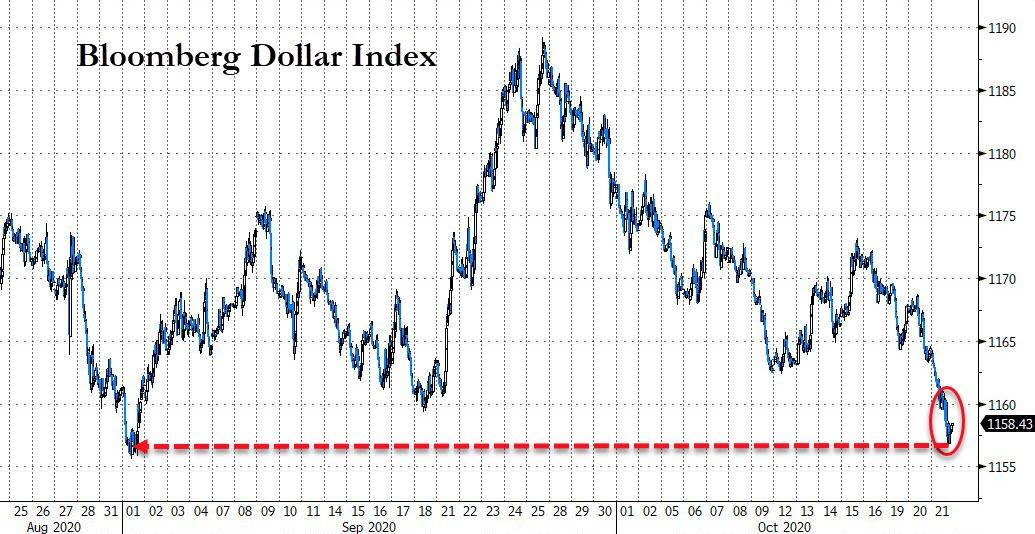
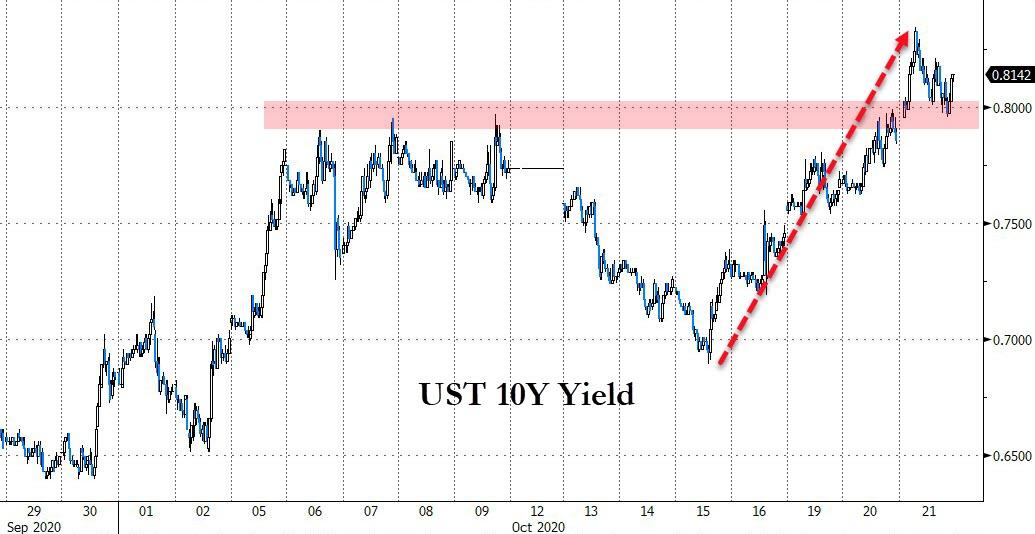
Stocks were down, bond (prices) were down, oil was down, the dollar was down, and economic data was down…
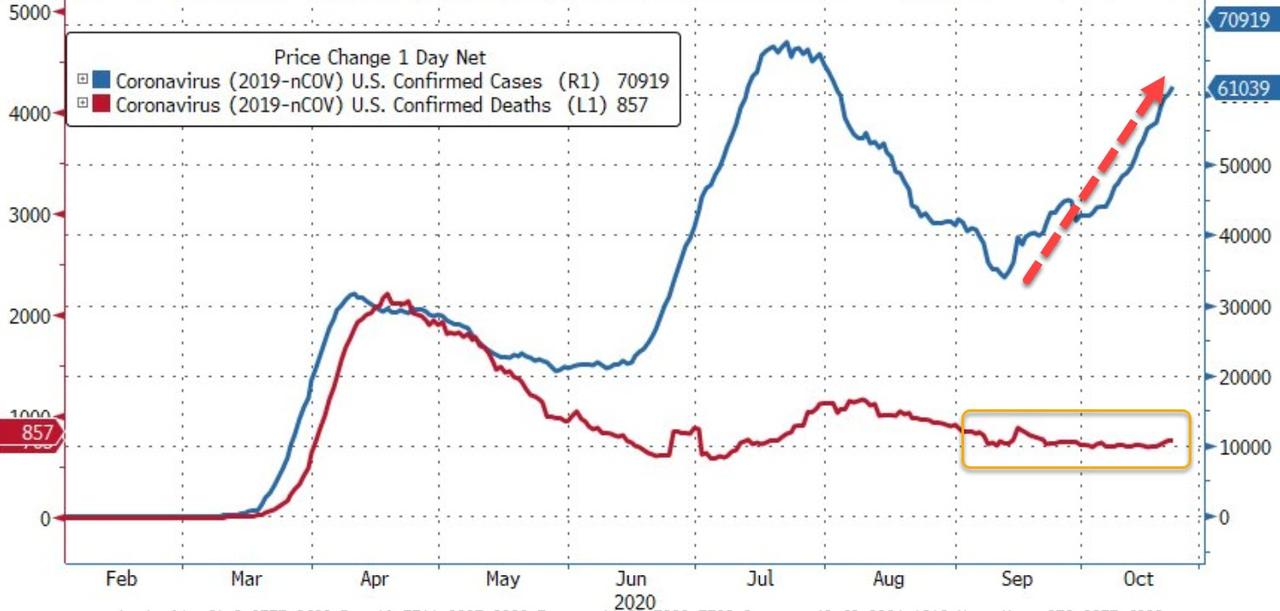
While the following is outside of my area of expertise, namely the Covid-19 pandemic, take a look at this chart and ask yourself “is the current panic really justified?”
Read More