
ETF Tracker StatSheet
You can view the latest version here.
CLOSING THE WEEK WITH A BANG
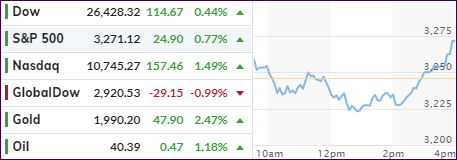
- Moving the markets
After Big Tech delivered blow-out earnings after the close yesterday, the futures market had the Nasdaq up by some 2% stoking hopes that the regular cash market would follow that bullish premise.
It was not meant to be, as the major indexes, despite starting the session in the green, lost momentum and subsequently dropped below their respective unchanged lines, but gold resisted the sell-off.
The Nasdaq fared the best despite mixed earnings results, disappointing econ data and the same inconclusive jawboning about the next corona virus rescue package by Dems and Reps on Capitol Hill.
Just as thigs looked the bleakest, a powerful rally pulled equities out of their doldrums, momentum reversed, and we closed out the week and the month with a bang. If you had to guess which asset class scored the best during July and said the “Nasdaq,” you would be wrong, as this chart shows:
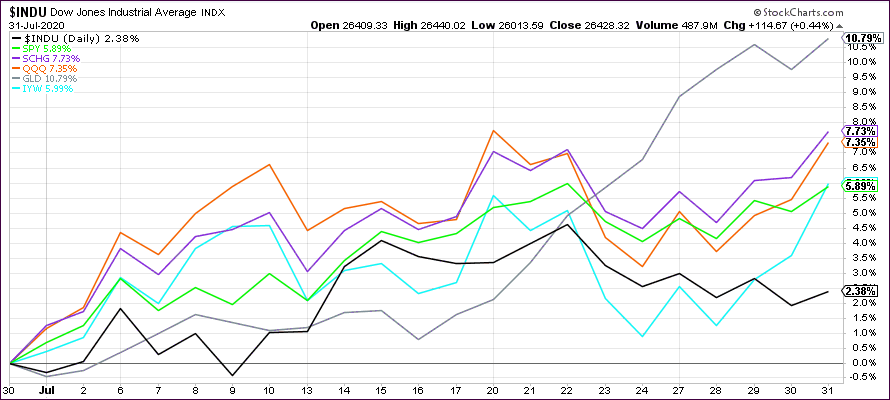
Gold (GLD) was the clear winner with +10.79% with the Nasdaq (QQQ) taking a distant 3rd place despite a respectful +7.35%, and the Dow being the laggard with +2.38%.
This asset bubble has now been seemingly blown out of proportion, thanks to Fed intervention, with ZH pointing to these stats:
All-time high monthly close in S&P 500
All-time low 10Y yield close
All-time high in gold
And then summing up the month:
Stocks up, Bonds up, Gold up, Silver up, Oil up, Crypto up, Dollar Down (along with Fed credibility.)
Be that as it may, the major trends for our selected ETFs remain bullish and will keep us invested until a substantial reversal occurs that triggers our exit strategy.
2. ETFs in the Spotlight
In case you missed the announcement and description of this section, you can read it here again.
It features some of the 10 broadly diversified domestic and sector ETFs from my HighVolume list as posted every Saturday. Furthermore, they are screened for the lowest MaxDD% number meaning they have been showing better resistance to temporary sell offs than all others over the past year.
The below table simply demonstrates the magnitude with which these ETFs are fluctuating above or below their respective individual trend lines (%+/-M/A). A break below, represented by a negative number, shows weakness, while a break above, represented by a positive percentage, shows strength.
For hundreds of ETF choices, be sure to reference Thursday’s StatSheet.
For this current domestic “Buy” cycle, here’s how some our candidates have fared:
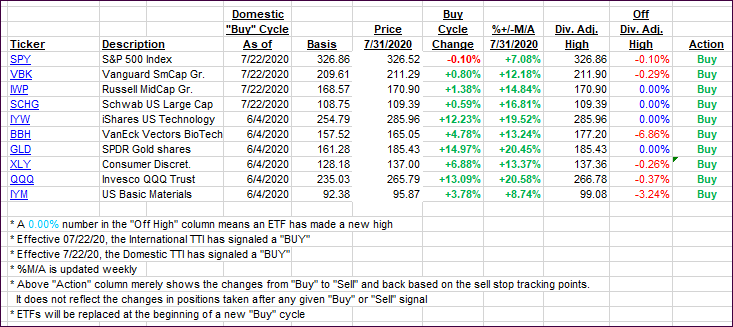
Click image to enlarge
Again, the %+/-M/A column above shows the position of the various ETFs in relation to their respective long-term trend lines, while the trailing sell stops are being tracked in the “Off High” column. The “Action” column will signal a “Sell” once the -8% point has been taken out in the “Off High” column. For more volatile sector ETFs, the trigger point is -10%.
3. Trend Tracking Indexes (TTIs)
Our TTIs went opposite ways with the Domestic one holding steady and the International one heading towards its trend line.
This is how we closed 07/31/2020:
Domestic TTI: +3.43% above its M/A (prior close +3.43%)—Buy signal effective 07/22/2020
International TTI: +0.22% above its M/A (prior close +1.22%)—Buy signal effective 07/22/2020
Disclosure: I am obliged to inform you that I, as well as my advisory clients, own some of the ETFs listed in the above table. Furthermore, they do not represent a specific investment recommendation for you, they merely show which ETFs from the universe I track are falling within the specified guidelines.
———————————————————-
WOULD YOU LIKE TO HAVE YOUR INVESTMENTS PROFESSIONALLY MANAGED?
Do you have the time to follow our investment plans yourself? If you are a busy professional who would like to have his portfolio managed using our methodology, please contact me directly or get more details here.
———————————————————
Back issues of the ETF Tracker are available on the web.
Contact Ulli