
- Moving the markets
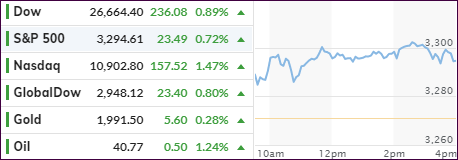
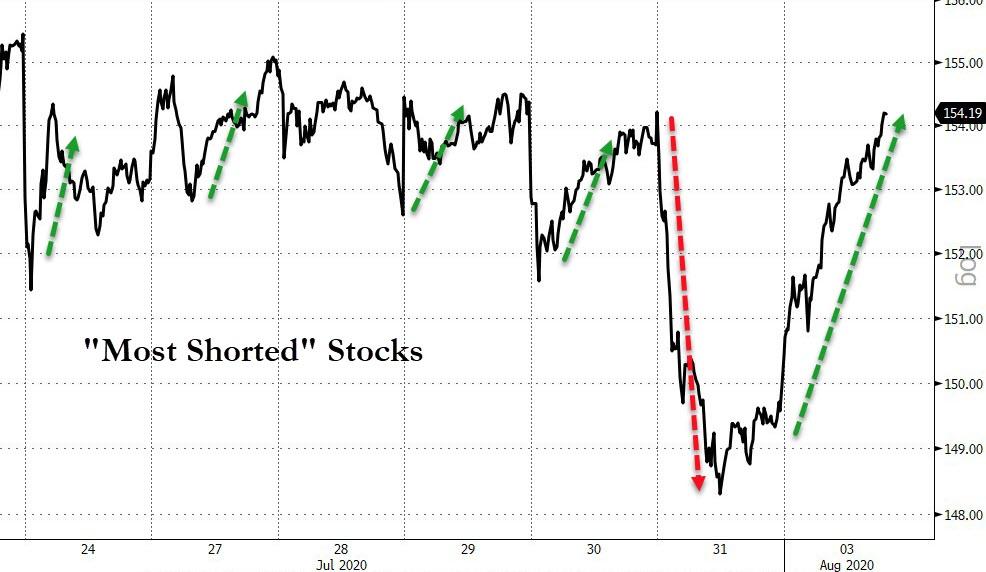
Friday’s last hour rebound served as a foundation for further advances, as the major indexes did not skip a beat, opened to the upside, never looked back, and ended up scoring another green close, which greatly benefitted our current positions. Helping matters was the impact of another strong short squeeze.
As we’ve seen in the past, the tech sector (Nasdaq) ruled by showing the strongest gains and surging to another high, while the S&P 500 placed 3rd among the major indexes.
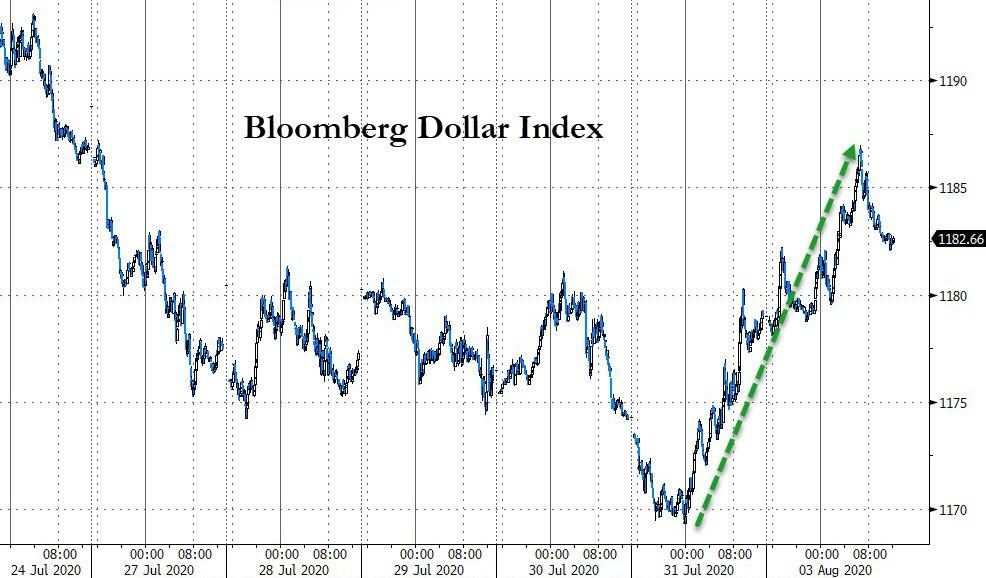
After a solidly higher opening, GLD bounced around aimlessly, slipped into the red but managed a nice bounce back into the close. It seems that the $2k glass ceiling appears to present formidable overhead resistance, but it will be broken eventually. Today, gold’s weakness was caused by a rallying dollar.
In economic news we learned that a manufacturing gauge rose while new orders jumped better than had been expected, which helped the bullish cause but still raised questions about its sustainability. Similar positive numbers in Europe and China supported their markets as well.
In terms of a new stimulus package, MarketWatch reported:
Market participants were also focused on the fact that there are no signs of a stimulus package between Democrats and Republicans after negotiations over the weekend failed to yield a replacement for a $600-a-week boost to unemployment benefits that expired Friday.
At issue for Democrats and Republicans is the amount of unemployment assistance for Americans. The White House has come out in favor of reducing the federal assistance to $200 a week, Democrats have called for keeping it at $600 a week. However, the parties appear to both support a fresh round of stimulus checks of $1,200 for workers.
Right now, upward momentum continues, and we will stay on board subject our exit strategy.
2. ETFs in the Spotlight
In case you missed the announcement and description of this section, you can read it here again.
It features some of the 10 broadly diversified domestic and sector ETFs from my HighVolume list as posted every Saturday. Furthermore, they are screened for the lowest MaxDD% number meaning they have been showing better resistance to temporary sell offs than all others over the past year.
The below table simply demonstrates the magnitude with which these ETFs are fluctuating above or below their respective individual trend lines (%+/-M/A). A break below, represented by a negative number, shows weakness, while a break above, represented by a positive percentage, shows strength.
For hundreds of ETF choices, be sure to reference Thursday’s StatSheet.
For this current domestic “Buy” cycle, here’s how some our candidates have fared:
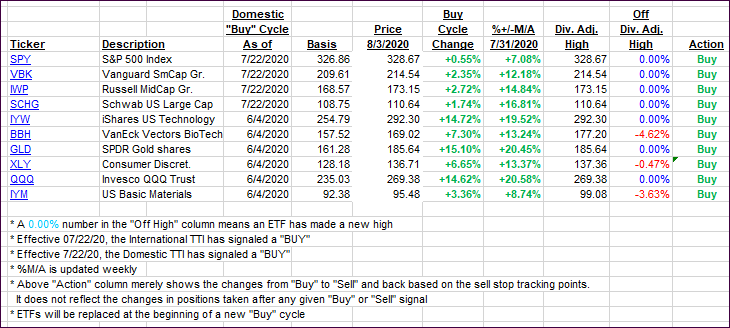
Click image to enlarge
Again, the %+/-M/A column above shows the position of the various ETFs in relation to their respective long-term trend lines, while the trailing sell stops are being tracked in the “Off High” column. The “Action” column will signal a “Sell” once the -8% point has been taken out in the “Off High” column. For more volatile sector ETFs, the trigger point is -10%.
3. Trend Tracking Indexes (TTIs)
Our TTIs inched higher with the International one taking a nice jump after almost dropping into the red on Friday.
This is how we closed 08/03/2020:
Domestic TTI: +3.68% above its M/A (prior close +3.43%)—Buy signal effective 07/22/2020
International TTI: +1.17% above its M/A (prior close +0.22%)—Buy signal effective 07/22/2020
Disclosure: I am obliged to inform you that I, as well as my advisory clients, own some of the ETFs listed in the above table. Furthermore, they do not represent a specific investment recommendation for you, they merely show which ETFs from the universe I track are falling within the specified guidelines.
Contact Ulli