Below, please find the latest High-Volume ETF Cutline report, which shows how far above or below their respective long-term trend lines (39-week SMA) my currently tracked ETFs are positioned.
This report covers the HV ETF Master List from Thursday’s StatSheet and includes 312 High Volume ETFs, defined as those with an average daily volume of more than $5 million, of which currently 265 (last week 264) are hovering in bullish territory. The yellow line separates those ETFs that are positioned above their trend line (%M/A) from those that have dropped below it.
In case you are not familiar with some of the terminology used in the reports, please read the Glossary of Terms. If you missed the original post about the Cutline approach, you can read it here.
STALLING FOUR DAYS IN A ROW BUT GAINING FOR THE WEEK
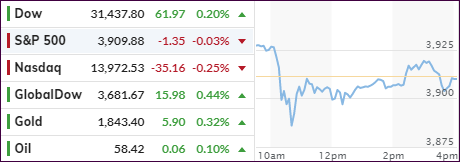
[Chart courtesy of MarketWatch.com]
Moving the markets
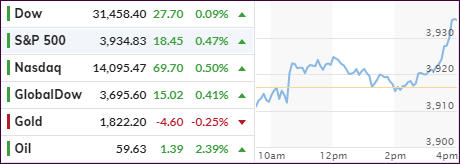
The aimless meandering of equities continued for the 4th day in a row, but a sudden ramp into the closed made today’s session a more successful one. ETF specific, SmallCaps lagged again (IWO: +0.11%), but MidCaps (IWP) picked up the speed and added +0.96% thereby trouncing the Nasdaq’s +0.50%.
Even with its tiny gain, the Dow managed to eke out another record high, following the S&P 500 and Nasdaq, which both set records yesterday in the face of only fractional advances.
Opined one analyst:
“Is the path to much higher equities becoming smaller … to put it differently, are the bulls attempting to thread a needle? Seems that way near term.”
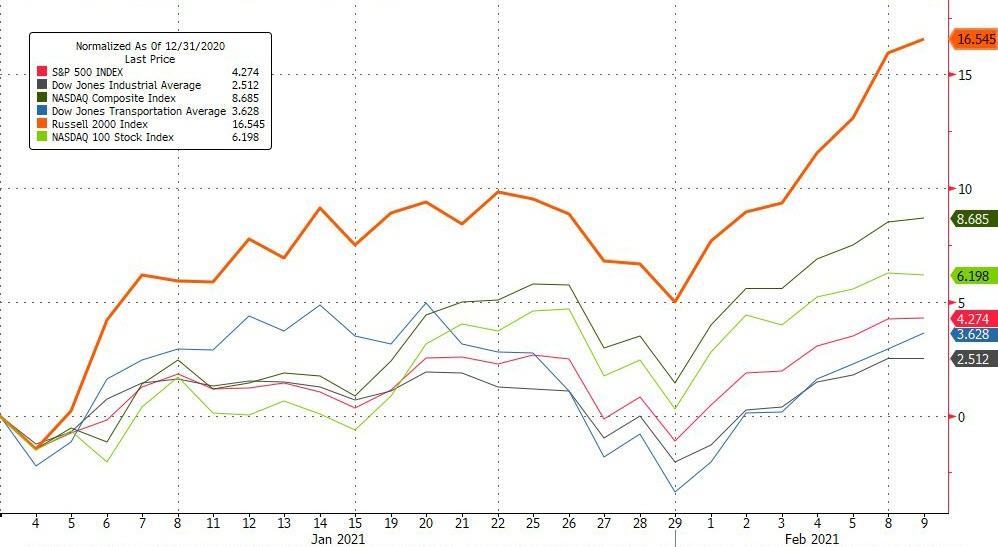
Be that as it may, February’s performance so far has been outstanding with the Dow gaining +4.7%, while S&P 500 and Nasdaq added +5.4% and +7.1% respectively. For the year 2021, the S&P has scored nine record closes.
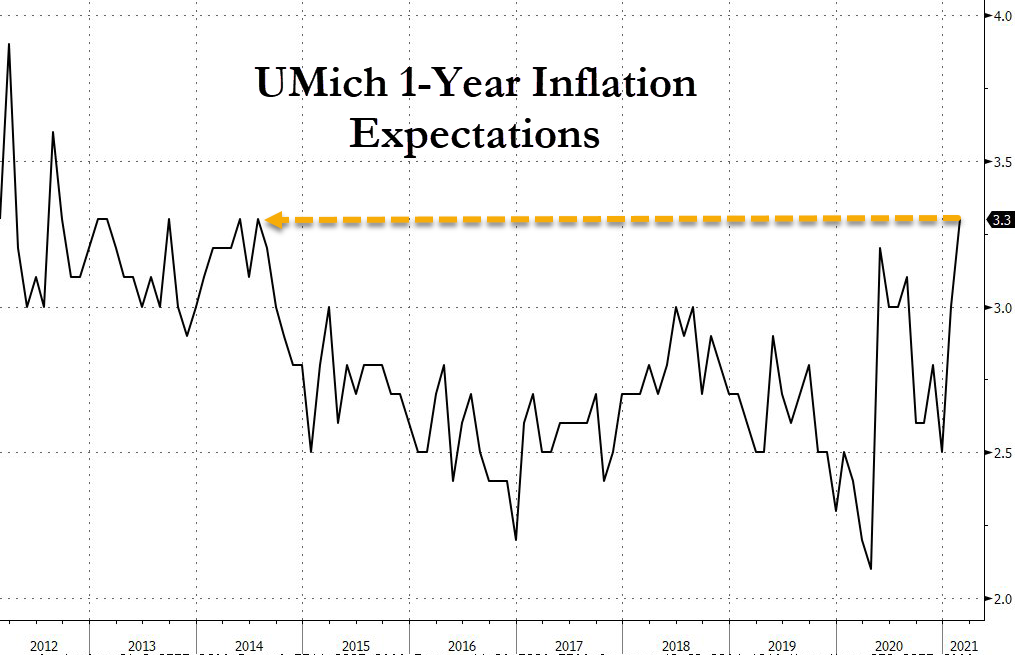
On the economic front, we learned that Consumer Sentiment declined to a six-month low due to personal income deteriorating and more Americans anticipating faster inflation in the year ahead, according to ZH.
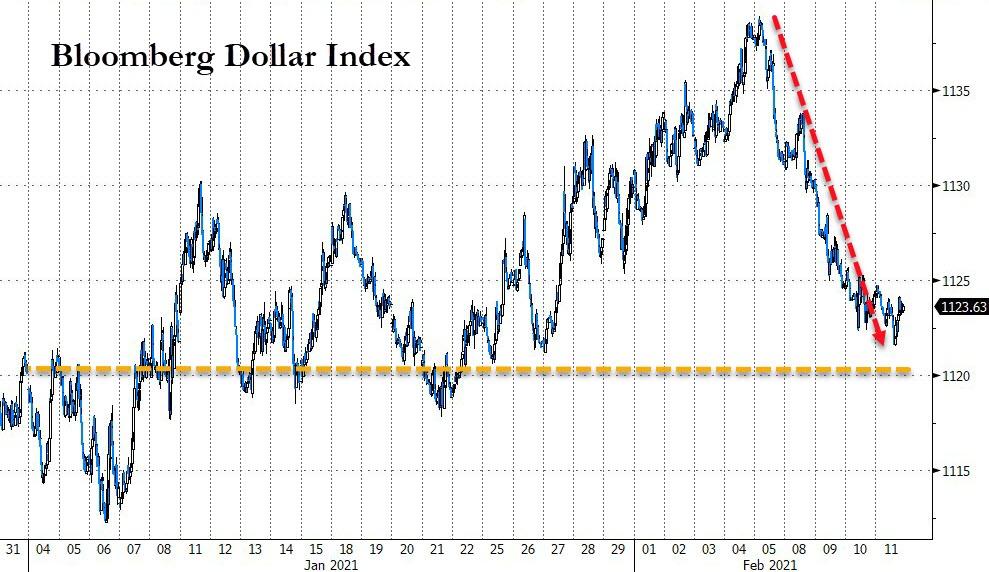
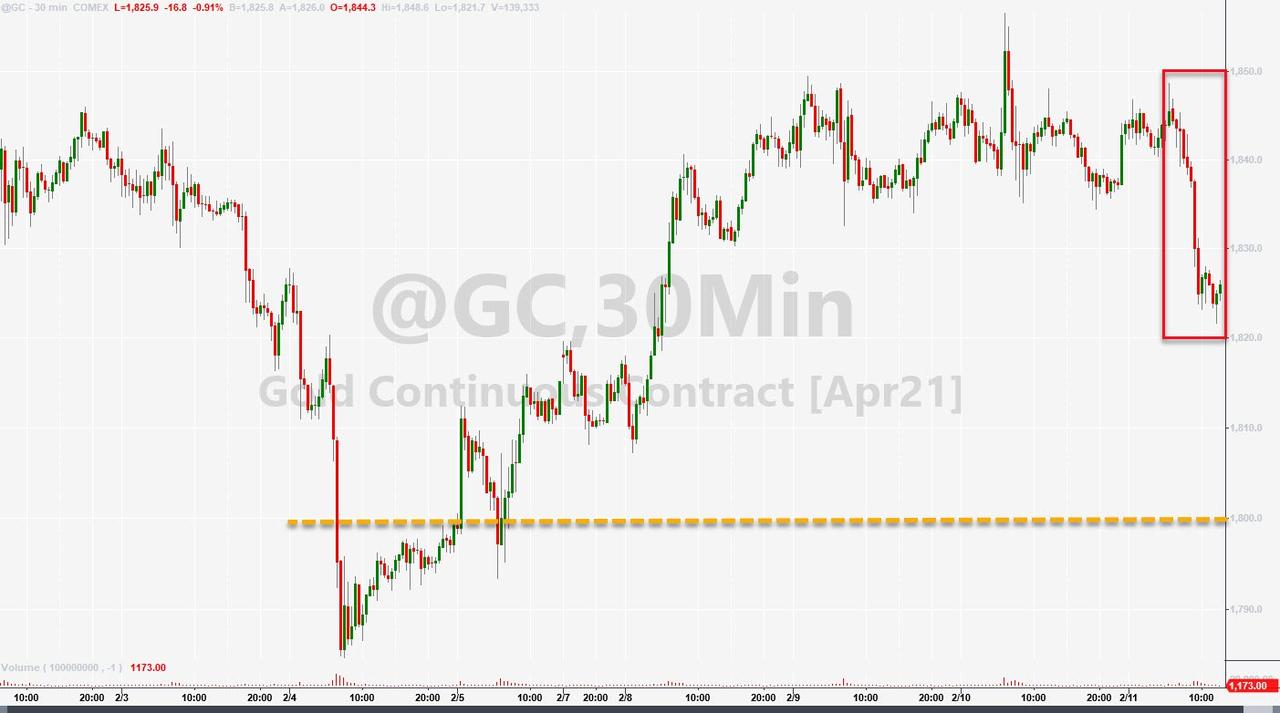
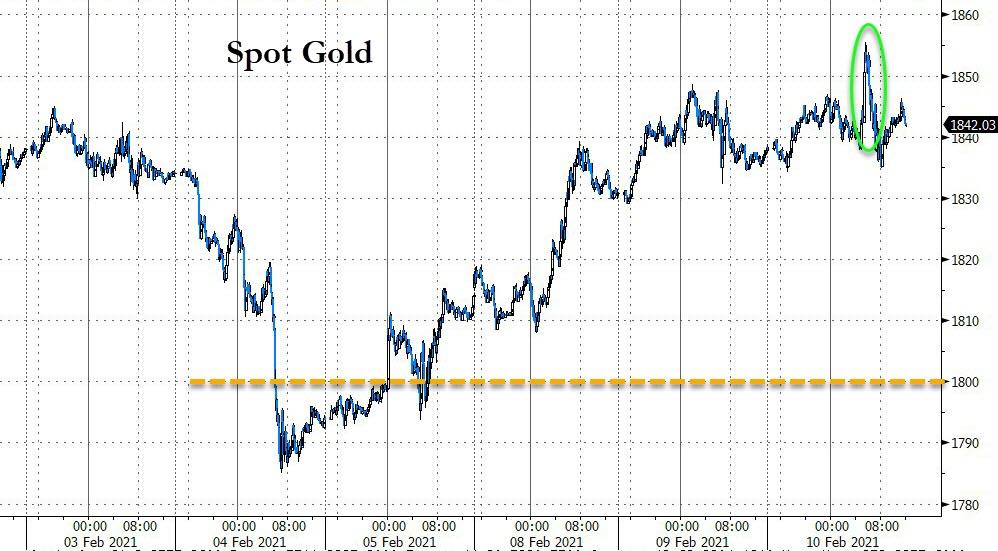
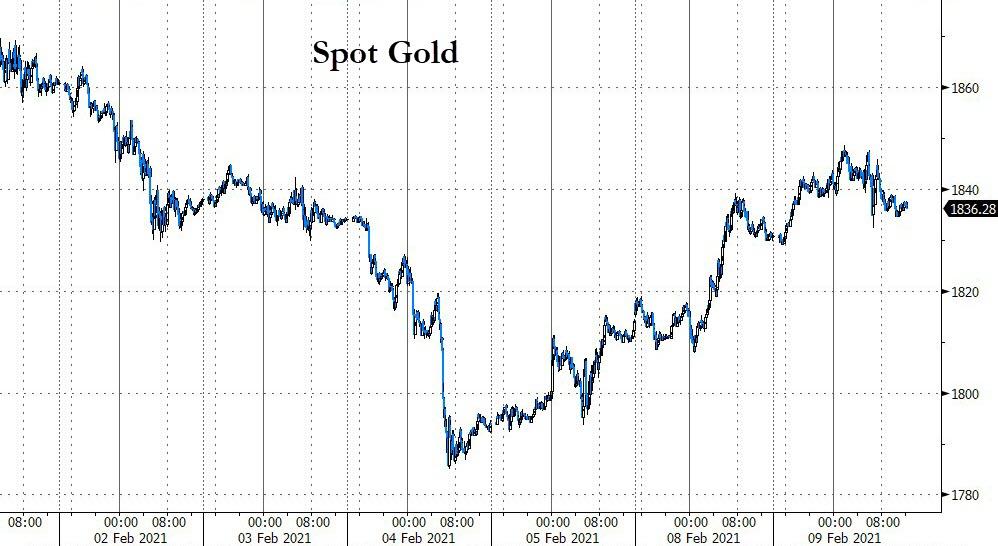
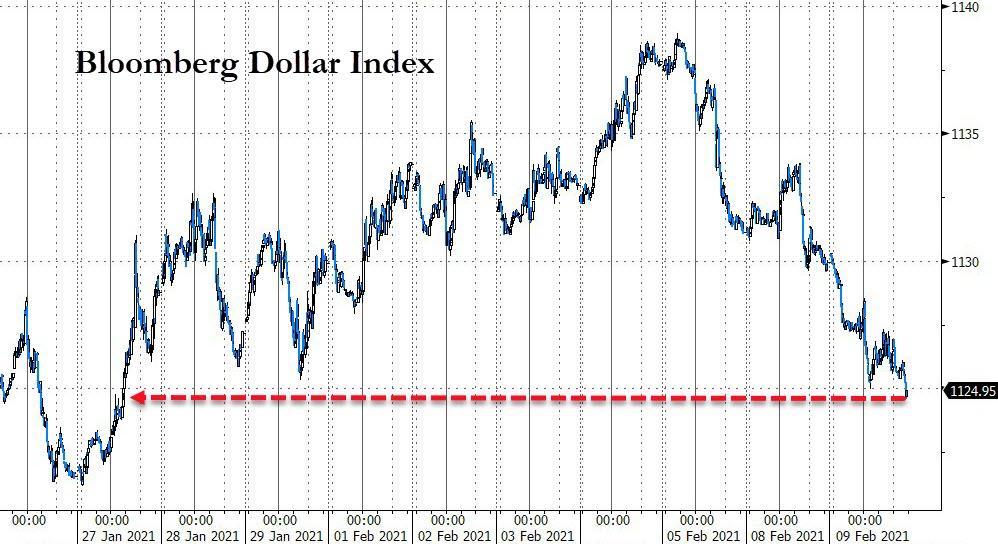
What kept the markets in check for most of the session were rising bond yields in the 10- and 30-year arena, thereby affecting gold negatively. Even though the US Dollar has been sliding for the past week or so, today it bounced moderately but enough to keep gold from recovering.
Despite the 4-day slowdown, today’s rally into close bodes well for Monday’s opening.
ETF Data updated through Thursday, February 11, 2021
Methodology/Use of this StatSheet:
1. From the universe of over 1,800 ETFs, I have selected only those with a trading volume of over $5 million per day (HV ETFs), so that liquidity and a small bid/ask spread are assured.
2. Trend Tracking Indexes (TTIs)
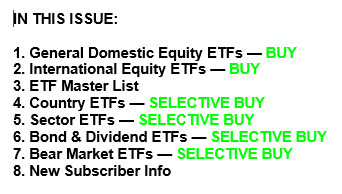
Buy or Sell decisions for Domestic and International ETFs (section 1 and 2), are made based on the respective TTI and its position either above or below its long-term M/A (Moving Average). A crossing of the trend line from below accompanied by some staying power above constitutes a “Buy” signal. Conversely, a clear break below the line constitutes a “Sell” signal. Additionally, I use a 7.5% trailing stop loss on all positions in these categories to control downside risk.
3. All other investment arenas do not have a TTI and should be traded based on the position of the individual ETF relative to its own respective trend line (%M/A). That’s why those signals are referred to as a “Selective Buy.” In other words, if an ETF crosses its own trendline to the upside, a “Buy” signal is generated. Since these areas tend to be more volatile, I recommend a wider trailing sell stop of 7.5%-10% depending on your risk tolerance.
If you are unfamiliar with some of the terminology, please see Glossary of Termsand new subscriber information in section 9.
1. DOMESTIC EQUITY ETFs: BUY— since 07/22/2020
Click on chart to enlarge
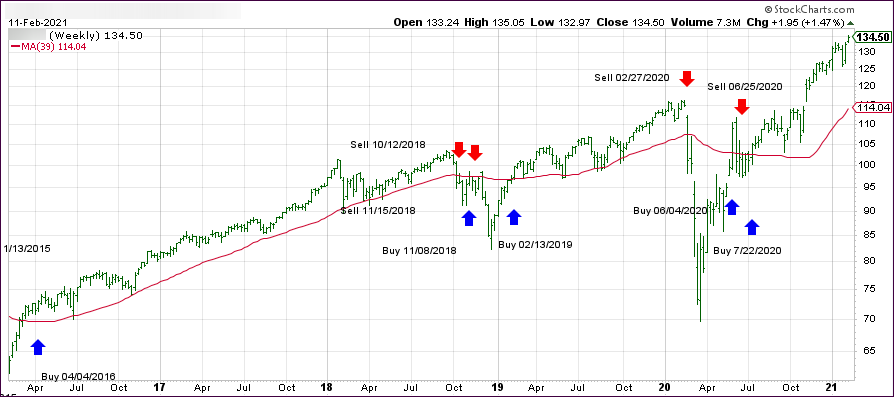
Our main directional indicator, the Domestic Trend Tracking Index (TTI-green line in the above chart) has now rallied above its long-term trend line (red) by +19.13% and remains in “BUY” mode as posted.
This session turned out to be very similar to the last two, with the major indexes looking for direction but ending up getting stuck in a sideways pattern with not much won and not much lost.
The S&P 500 and Nasdaq eked out some small gains while the Dow slipped a tad into the red. Even this year’s powerhouse, SmallCaps (IWO), could not muster any strength, but closed in the green by a meager +0.08% and were outperformed by MidCaps (IWP), which sported a +0.72% gain.
It appears that the strong February rally has hit a flat spot and is need of a new driver to pick up the recently lost momentum. Fiscal and monetary stimulus have been priced in the markets, with all eyes now being on a broader economic recovery, along with a broader reopening of businesses and an improved distribution of the vaccine.
Not helping matters today was a worse-than-expected reading of weekly jobless claims. First time filers totaled 793k, which was higher than the expected 760k. Those week numbers go along with Fed head Powell’s assessment yesterday that “in real terms, unemployment remains around 10%, as bad as at the peak of the financial crises.”
He then added:
“Published unemployment rates during COVID have dramatically understated the deterioration in the labor market.”
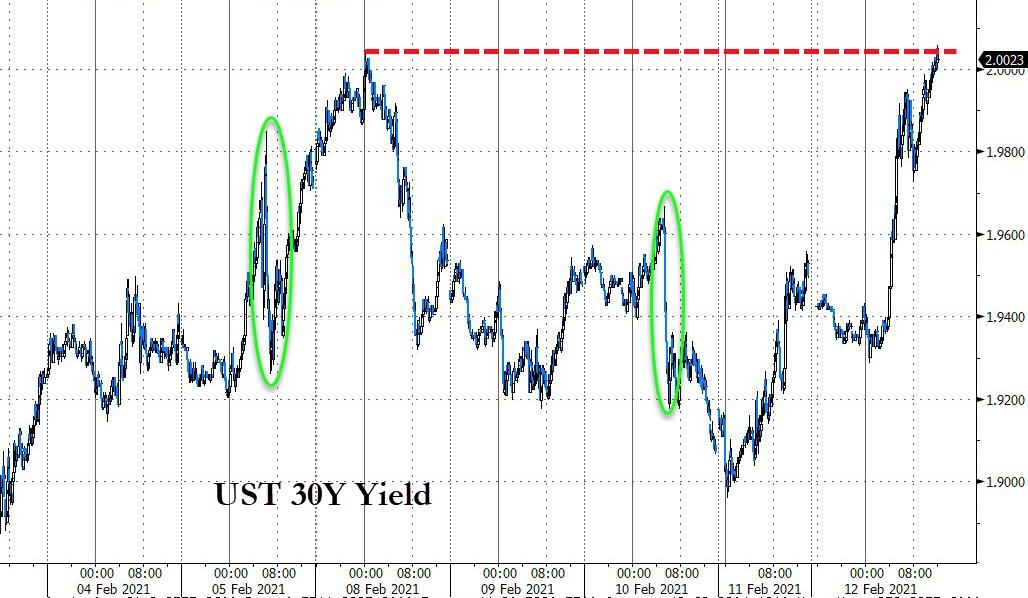
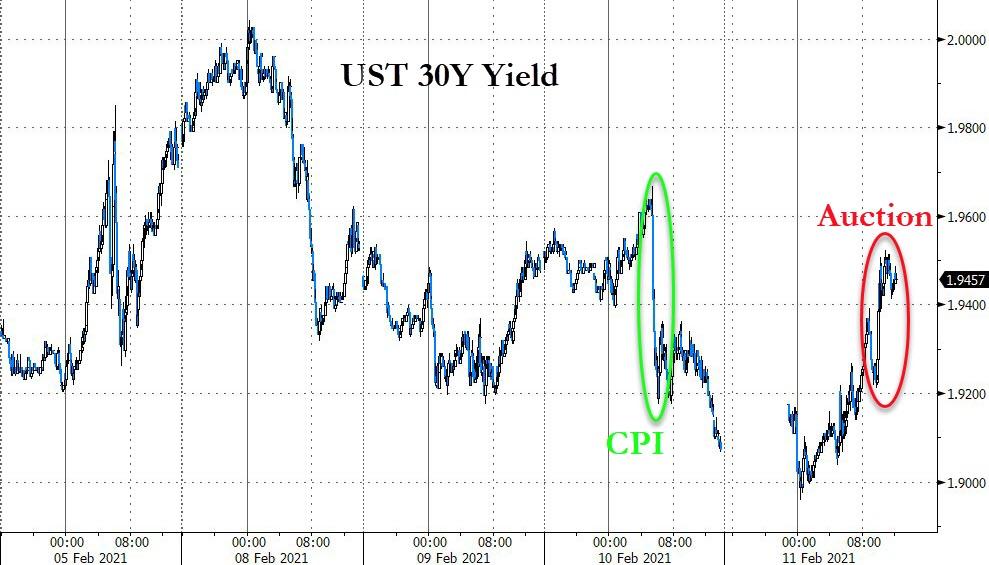
Also increasing uncertainty was the rise in bond yields during the 30-year auction, which left some traders scratching their head, as yields spiked after their recent easing, demonstrated in this chart by Bloomberg.
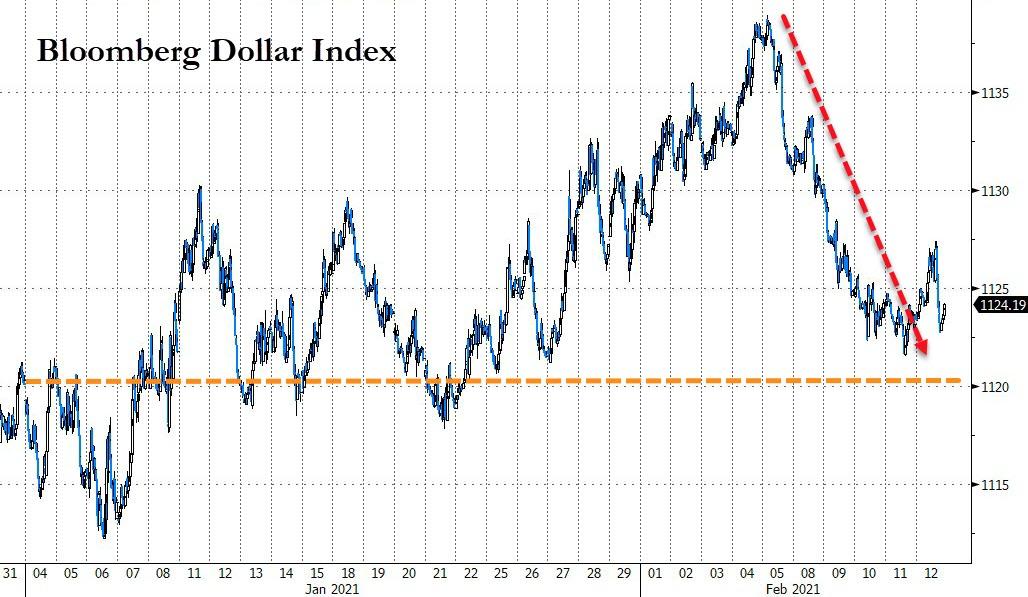
The US Dollar continued on its southerly path, but it was not enough, given spiking bond yields, to support gold, which subsequently surrendered -0.88%.
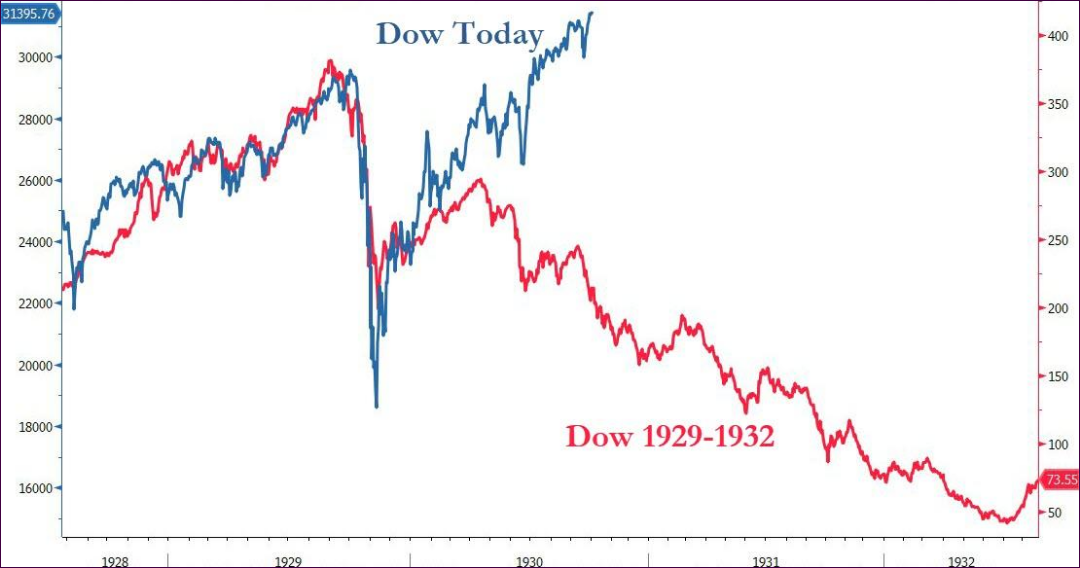
ZH featured another analog comparison to the 1929-1932 period asking this question:
“It’s different this time…but will it end the same?”
Up—down—sideways—up, and down pretty much describes the journey the major indexes took today with the result being an unchanged outcome. However, the Dow squeezed out a tiny gain of +0.20%, but that move was sufficient for the index to eke out another record closing high.
Not even SmallCaps, the winner YTD, were able to gather any momentum and ended lower by -1.07%. Saving the day to a small degree were MidCaps (IWO) with +0.16% and GLD, which again managed a green close by adding another +0.39%.
All eyes were on the outcome of a Fed speech with CNBC describing it like this:
Federal Reserve Chairman Jerome Powell said Wednesday monetary policy needs to stay “patiently accommodative” to support the economy that still faces challenges in the labor market. The employment picture is “a long way” from where it needs to be, the central bank chief told the Economic Club of New York.
Despite the past 2 days having been non-events in terms of performance, keep in mind that so far this has been a strong February with the S&P 500 having gained some 5%, mainly because of continued optimism about the massive Covid-19 stimulus package with more on deck, according to CNBC:
House Democrats unveiled the details of a relief proposal that included $1,400 direct checks with faster phase-outs than previous bills. President Joe Biden and Treasury Secretary Janet Yellen met with CEOs of JPMorgan, Walmart and Gap Tuesday to discuss additional economic relief.
All the above, if executed as planned, will be exactly the kind of accommodation the markets are looking for and should keep equities moving higher—until the day they won’t. But that moment in time is an unknown date in the future. It also is the main reason why I continue to pounce on the importance of having an exit strategy.
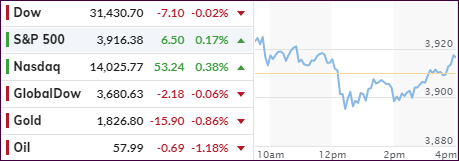
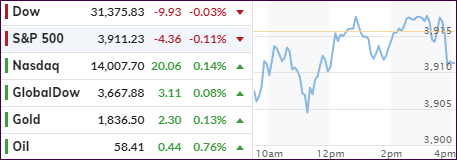
After the relentless march higher over the past 6 trading days, it was time for a pause. That is exactly what we saw today, as the major indexes dropped early on, recovered, and then hung around their respective unchanged lines. Only the Nasdaq was able to eke out a green close, albeit a tiny one, as the chart above shows.
Yet, despite this trip to nowhere, some of our holdings bucked the trend thereby turning this day into a positive one. Given its YTD history, you will not be surprised to hear that SmallCaps (IWO) ruled with another solid showing of +0.72%, which was closely followed by MidCaps (IWP) with +0.54%.
Even GLD managed a green close for the second day in a row by adding +0.34%, supported by a sliding US Dollar and lower bond yields.
With market optimism continuing unabated, BofA Research had this to say:
“Among the pillars of this unprecedented bullish sentiment is the market’s pricing in of perfection on the policy front (maximal Fed accommodation, smooth fiscal passage of $1.9tn and more, and a steady vaccine rollout) while improvement from economic data may already be “as good as it gets”.
Then this word of caution and a suggestion:
Bank of America said a market correction could be on the horizon as the recent runup has shown signs of overheating, but it will be a buying opportunity for equity investors.
If all else fails, that’s how you cover both sides of the equation.