
ETF Tracker StatSheet
You can view the latest version here.
DOW ROUNDTRIPS 600 POINTS IN VOLATILE SESSION
- Moving the markets
Yesterday’s sell-off continued with utter abandon early on, but mid-day buying limited the losses, however, the tech sector again took the biggest beating.
The relentless waves of selling caused me to liquidate one of our most volatile tech holdings, as it bounced against its trailing sell stop. It was a move motivated by profit taking, as more downside could have turned a gain into a loss.
While the jury is still out as to whether this tech fallout will continue next week, it’s not surprising that after the recent relentless ramp, this sharp pullback occurred. The magnitude of the next move is an unknown, but the possibility of this bubble bursting further certainly exists.
“We’ve had excessive valuations in the markets lately — particularly in the tech sector — and that needed to be corrected to some degree,” said Scott Knapp, chief market strategist at CUNA Mutual Group. “One needs to look no further than the recent irrational run-up in Tesla and Apple share prices after both companies announced a stock split to see overexuberance, especially among retail investors.”
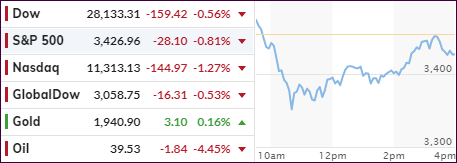
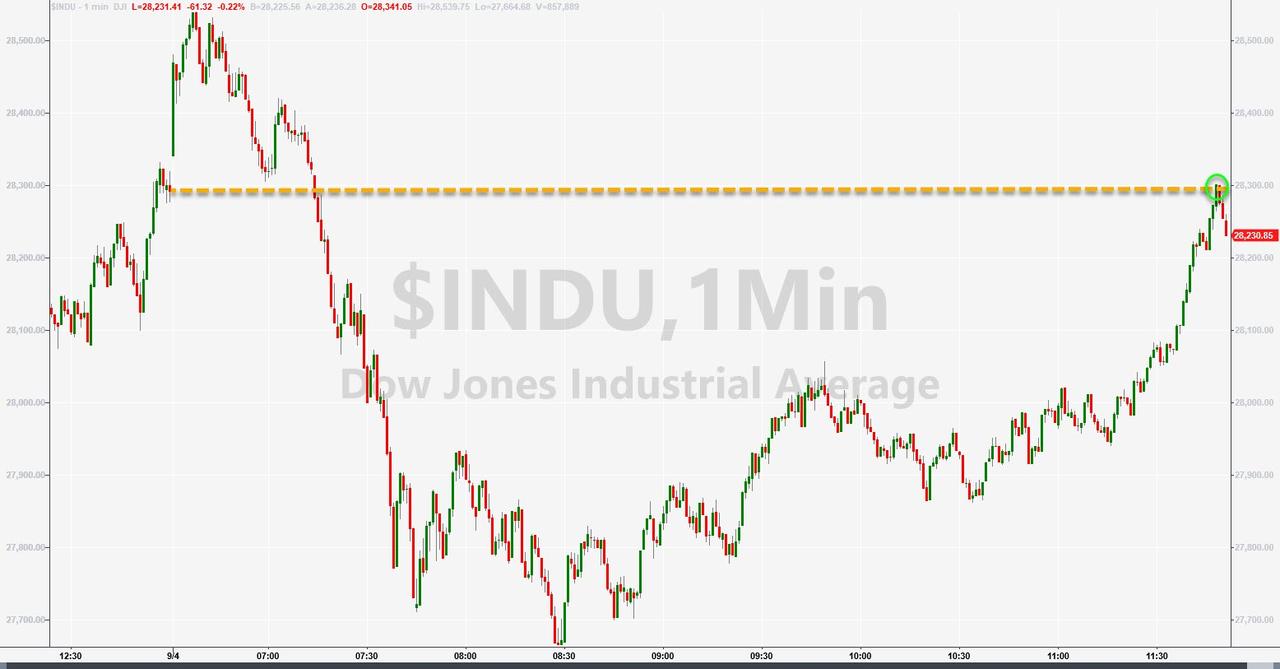
The Dow roundtripped about 600 points and briefly crossed into the green before succumbing to selling during the last 30 minutes of trading. Gold, on the other hand, managed to crawl out of a mid-day hole to close on the plus side.
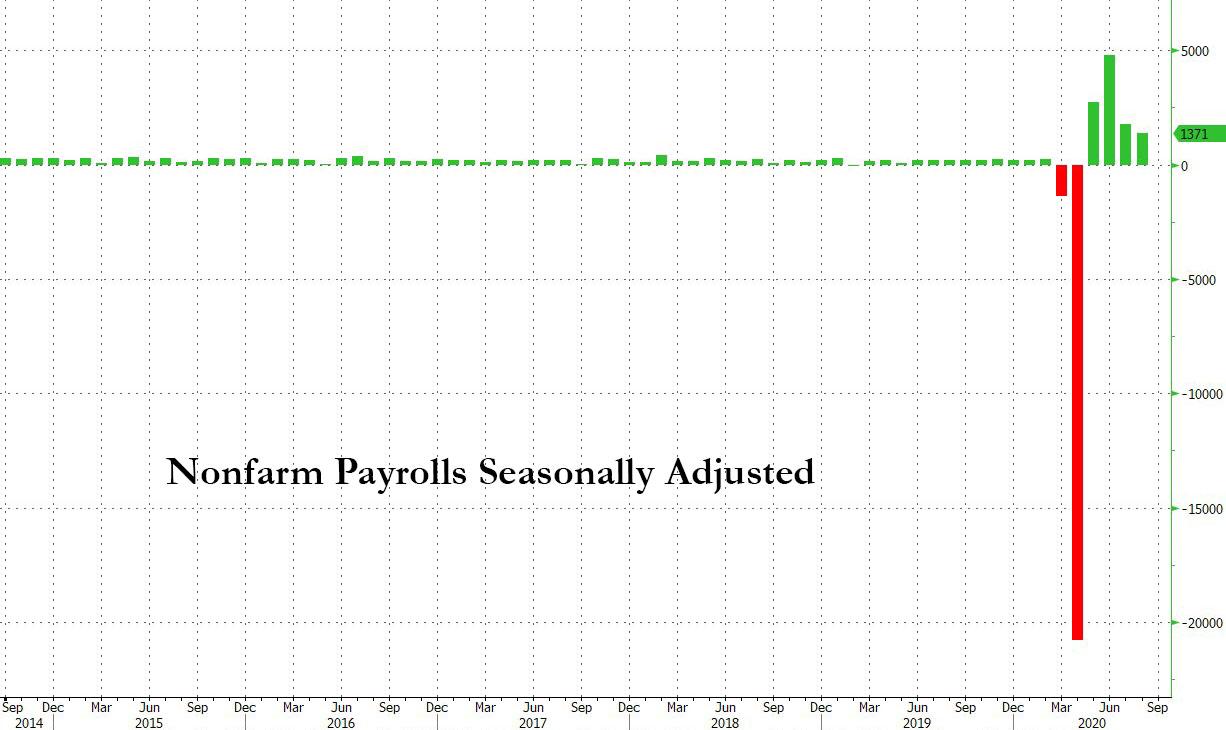
In economic news, ZH reported that in August some 1.371 mm payrolls were created, just a tad higher than the 1.35 mm expected, while the unemployment rate tumbled to 8.4%. But, looking under the hood, we see a dose of reality sprinkled in the “great surface jobs numbers:”
For one, the one-time impact of the Census had an outlier effect on the August payrolls, due to 238,000 temporary jobs hired for the 2020 Census. This led to a 251,000 jump in Federal workers, and a near record 344,000 increase in total government jobs. This means that government jobs were a whopping 25% of all job gains in August.
In the end, it was a whip-saw week, the worst one in some 6 months, as the S&P 500 dropped a modest -2.3% with the Nasdaq faring a lot worse and now diverging again from the 10-year bond yield.
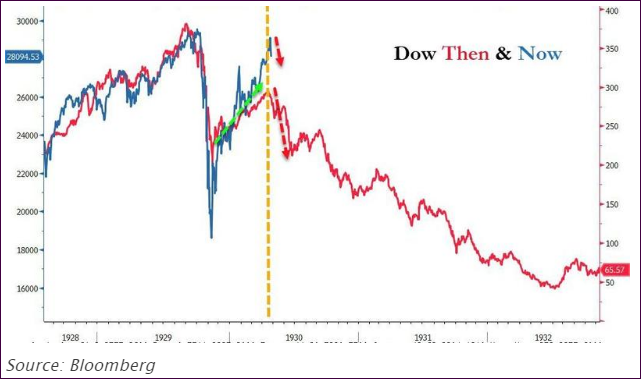
In the big picture, it remains to be seen if this historical analog will repeat itself:
Enjoy the Labor Day weekend.
2. ETFs in the Spotlight
In case you missed the announcement and description of this section, you can read it here again.
It features some of the 10 broadly diversified domestic and sector ETFs from my HighVolume list as posted every Saturday. Furthermore, they are screened for the lowest MaxDD% number meaning they have been showing better resistance to temporary sell offs than all others over the past year.
The below table simply demonstrates the magnitude with which these ETFs are fluctuating above or below their respective individual trend lines (%+/-M/A). A break below, represented by a negative number, shows weakness, while a break above, represented by a positive percentage, shows strength.
For hundreds of ETF choices, be sure to reference Thursday’s StatSheet.
For this current domestic “Buy” cycle, here’s how some our candidates have fared:
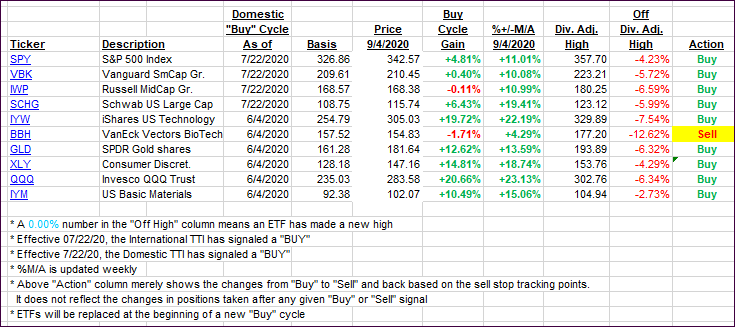
Click image to enlarge
Again, the %+/-M/A column above shows the position of the various ETFs in relation to their respective long-term trend lines, while the trailing sell stops are being tracked in the “Off High” column. The “Action” column will signal a “Sell” once the -8% point has been taken out in the “Off High” column. For more volatile sector ETFs, the trigger point is -10%.
3. Trend Tracking Indexes (TTIs)
Our TTIs changed only immaterially despite the huge swing in the markets.
This is how we closed 09/04/2020:
Domestic TTI: +7.52% above its M/A (prior close +7.77%)—Buy signal effective 07/22/2020
International TTI: +5.45% above its M/A (prior close +5.95%)—Buy signal effective 07/22/2020
Disclosure: I am obliged to inform you that I, as well as my advisory clients, own some of the ETFs listed in the above table. Furthermore, they do not represent a specific investment recommendation for you, they merely show which ETFs from the universe I track are falling within the specified guidelines.
———————————————————-
WOULD YOU LIKE TO HAVE YOUR INVESTMENTS PROFESSIONALLY MANAGED?
Do you have the time to follow our investment plans yourself? If you are a busy professional who would like to have his portfolio managed using our methodology, please contact me directly or get more details here.
———————————————————
Back issues of the ETF Tracker are available on the web.
Contact Ulli