
- Moving the markets
Yesterday’s “reckless advance,” as I titled it, hit the skids today with a long overdue correction instilling some reality in the markets that nothing can go up forever nor in a straight line.
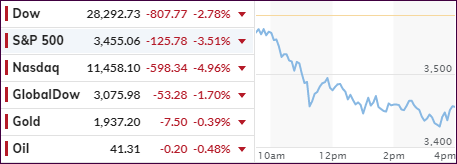
As a result, the major indexes plunged with the Nasdaq setting the dubious record of giving back the most, namely almost 5%, while snapping a 10-day winning streak and surrendering all of September’s gains.
However, given its relentless rally over the past few months, this was to be expected, the question in my mind was only “when” and “how much?” The Fang stocks like Apple, Amazon, Netflix, Facebook, Google and Microsoft all donned red numbers for the session.
The question now remains if today’s negative action was an outlier or a sign of things to come. Opined Liz Ann Saunders, investment strategist at Charles Schwab:
“I’m not sure that just today’s weakness is sufficient enough to ease some of those excesses and tell the short-term folks this is the kind of dip you want to buy. I don’t have a clear crystal ball more than anybody else, but certainly the excess suggests something more than a single-day compression in the high-flyers may be necessary to kind of right the ship.”
For clarity, ZH pointed to this chart showing the divergence between the Nasdaq and the 10-year yield closing, which could be an ominous sign of things to come, as the longer term chart demonstrates.
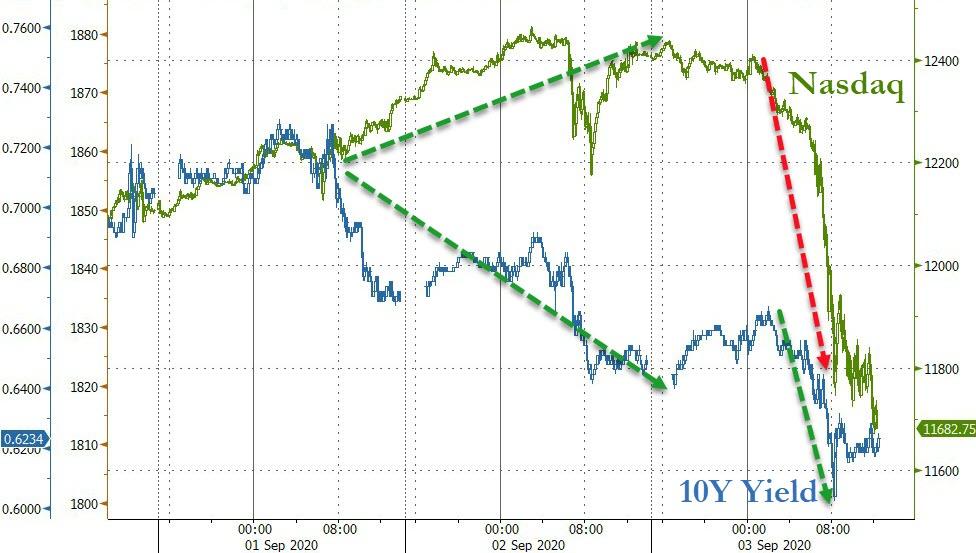
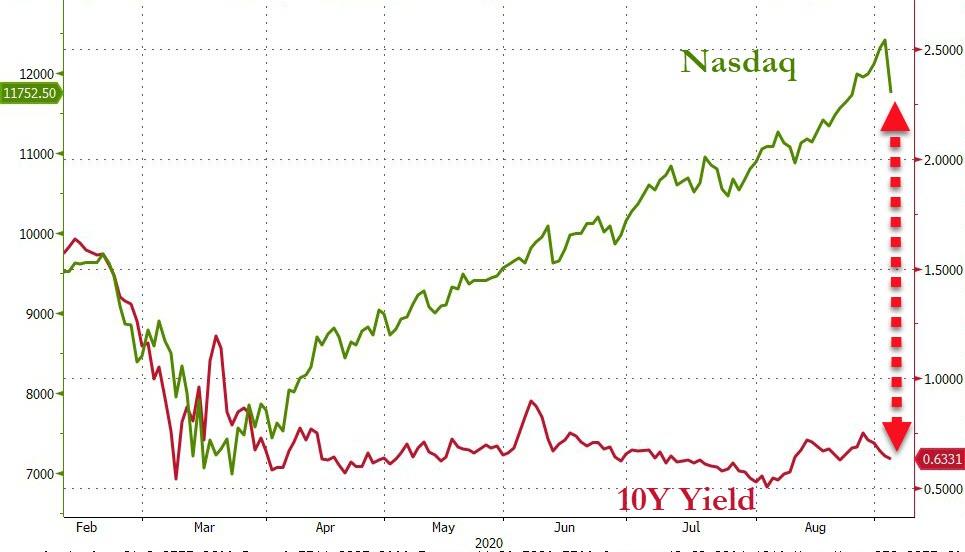
On the economic front, none of the numbers were able to provide market support. We learned that US Services data weakened in August amid a “highly uncertain path ahead,” as ZH called it. Filings for First-Time Unemployment benefits fell below the 1 million mark, but stilled showed a horrific number, namely 881,000 Americans looking for assistance.
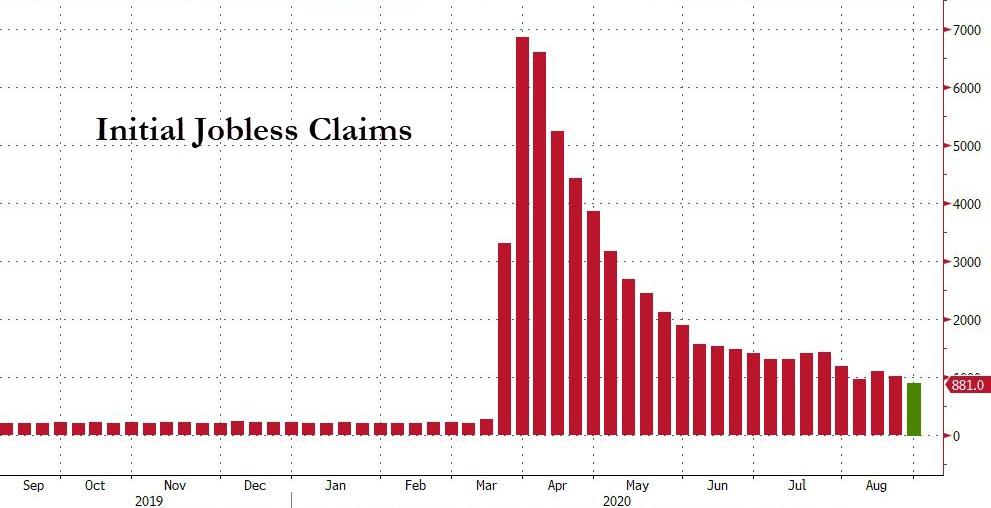
Estimates as to where the S&P 500 might end up by the end of the year vary wildly, but I had to chuckle when I saw BofAs forecast range of 2,200 to 4,000. Hmm, why not make it 1,000 to 5,000 just to be safe? Of course, I am being facetious here, but looking at those kinds of wide-ranging estimates is simply a waste of time.
Despite today’s correction, none of our trailing sell stops were triggered. Gold dropped as well but to a much lesser degree than equities.
2. ETFs in the Spotlight
In case you missed the announcement and description of this section, you can read it here again.
It features some of the 10 broadly diversified domestic and sector ETFs from my HighVolume list as posted every Saturday. Furthermore, they are screened for the lowest MaxDD% number meaning they have been showing better resistance to temporary sell offs than all others over the past year.
The below table simply demonstrates the magnitude with which these ETFs are fluctuating above or below their respective individual trend lines (%+/-M/A). A break below, represented by a negative number, shows weakness, while a break above, represented by a positive percentage, shows strength.
For hundreds of ETF choices, be sure to reference Thursday’s StatSheet.
For this current domestic “Buy” cycle, here’s how some our candidates have fared:
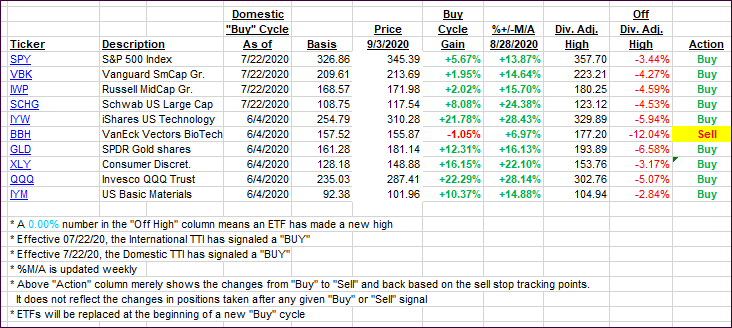
Click image to enlarge
Again, the %+/-M/A column above shows the position of the various ETFs in relation to their respective long-term trend lines, while the trailing sell stops are being tracked in the “Off High” column. The “Action” column will signal a “Sell” once the -8% point has been taken out in the “Off High” column. For more volatile sector ETFs, the trigger point is -10%.
3. Trend Tracking Indexes (TTIs)
Our TTIs stumbled with the markets and came off their highs.
This is how we closed 09/03/2020:
Domestic TTI: +7.77% above its M/A (prior close +10.31%)—Buy signal effective 07/22/2020
International TTI: +5.95% above its M/A (prior close +7.82%)—Buy signal effective 07/22/2020
Disclosure: I am obliged to inform you that I, as well as my advisory clients, own some of the ETFs listed in the above table. Furthermore, they do not represent a specific investment recommendation for you, they merely show which ETFs from the universe I track are falling within the specified guidelines.
Contact Ulli