
- Moving the markets
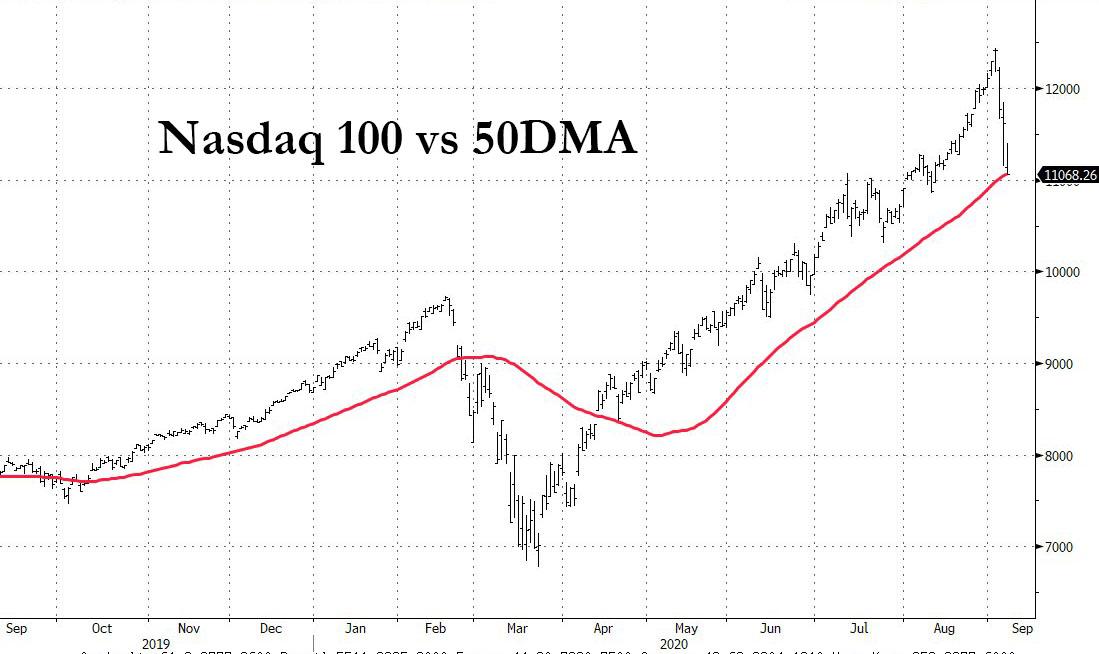
After 3 days of the markets getting slammed, with the Nasdaq having one of its worst stretches and reaching correction territory, conditions became so oversold that buyers stepped in and restored bullish momentum.
As it turned out, the Nasdaq 100’s 50 day Moving Average provided critical support, at least for this session, and up we went.
“A setback like that seen in Nasdaq stocks over the past days has been overdue,” Commerzbank strategist Alexander Kraemer wrote citing excessive valuations. “Nonetheless, the underlying drivers of the recent rally remain in place. We believe that the recent setback will emerge as a buying opportunity for year-end performance.”
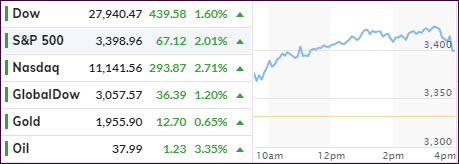
All the major indexes ripped higher, but the tech sector took top billing with a gain of +2.71%, but it is still down some 8% from its recent highs.
Tweeted analyst Jim Bianco:
The NASDAQ completed a 10% correction just 3 trading days after setting a new all-time high (September 2). This sets a new record for the fastest 10% correction in history.
The old record was 6 trading days from Feb 19 to Feb 27, 2020.
The NASDAQ Index started in 1978.
Even disappointing Covid-19 vaccine news and a ZH report that US Hiring unexpectedly plunged my most on record, despite a surge in Job Openings, nothing could stop the markets from thundering back.
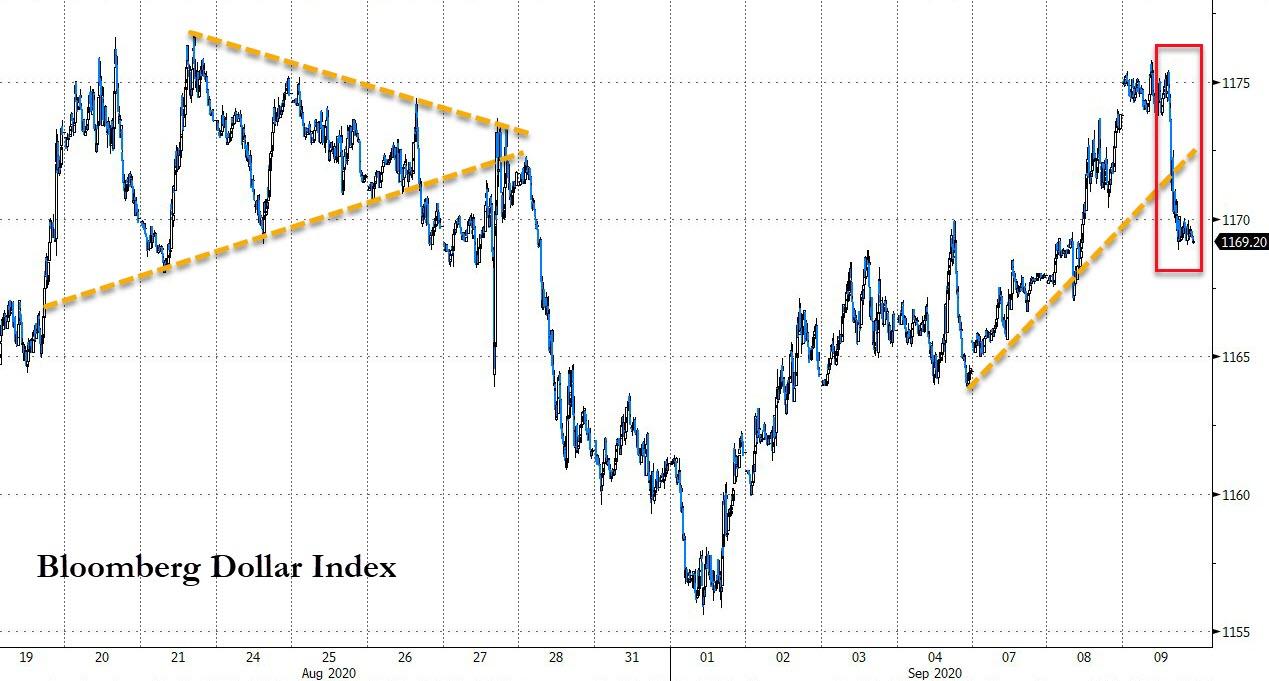
The US dollar tanked, after recent advances, which helped gold to recover with GLD gaining a solid +0.97%.
We must wait and see if this was truly a turnaround Wednesday, or merely a hopeful blip in an ongoing correction.
2. ETFs in the Spotlight
In case you missed the announcement and description of this section, you can read it here again.
It features some of the 10 broadly diversified domestic and sector ETFs from my HighVolume list as posted every Saturday. Furthermore, they are screened for the lowest MaxDD% number meaning they have been showing better resistance to temporary sell offs than all others over the past year.
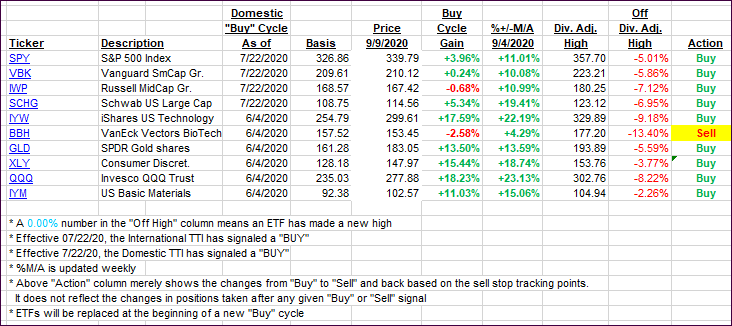
The below table simply demonstrates the magnitude with which these ETFs are fluctuating above or below their respective individual trend lines (%+/-M/A). A break below, represented by a negative number, shows weakness, while a break above, represented by a positive percentage, shows strength.
For hundreds of ETF choices, be sure to reference Thursday’s StatSheet.
For this current domestic “Buy” cycle, here’s how some our candidates have fared:
Click image to enlarge
Again, the %+/-M/A column above shows the position of the various ETFs in relation to their respective long-term trend lines, while the trailing sell stops are being tracked in the “Off High” column. The “Action” column will signal a “Sell” once the -8% point has been taken out in the “Off High” column. For more volatile sector ETFs, the trigger point is -10%.
3. Trend Tracking Indexes (TTIs)
Our TTIs joined the comeback and surged.
This is how we closed 09/09/2020:
Domestic TTI: +6.50% above its M/A (prior close +5.29%)—Buy signal effective 07/22/2020
International TTI: +5.41% above its M/A (prior close +4.10%)—Buy signal effective 07/22/2020
Disclosure: I am obliged to inform you that I, as well as my advisory clients, own some of the ETFs listed in the above table. Furthermore, they do not represent a specific investment recommendation for you, they merely show which ETFs from the universe I track are falling within the specified guidelines.
Contact Ulli