
- Moving the markets
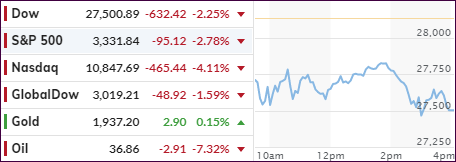
Last Thursday’s sharp sell-off, which continued Friday in a more moderate fashion, thanks to a late rebound, accelerated today, as the Labor Day weekend did nothing to encourage a return to bullishness. Instead, the major indexes puked again, with the Nasdaq showing the steepest losses except for crude oil, which took top billing by swan diving almost -7%.
News about Softbank’s tech sector manipulation over the past few weeks made the headlines at ZeroHedge, as it became clear that the company, by using a sophisticated deployment of options and the their underlying stocks via billions of dollars, catapulted the markets no reckless heights, only to then unwind their positions leaving the Nasdaq supported by nothing other than an air pocket.
Added ZeroHedge:
Well, that escalated quickly… All of a sudden, out of nowhere, the Nasdaq, and most especially its high-flying mega-tech members, are collapsing faster than an Adam Schiff narrative. No news, no earnings, no headlines… just the fact that a massively over-levered Japanese ‘hedge fund’ is no longer buying massive exposure in call options and sparking the virtuous opening bid to ignite momentum and set the Robinhood traders up for the day.
The markets ended up bobbing and weaving on the red side of the unchanged line all day and accelerated into the close. Good thing, we started to lighten up on our most volatile tech holding last week and will continue to do so, as respective trailing sell stops get triggered.
Can things get worse? Here’s one opinion:
“Given how extreme many of the indicators we follow had become by early this past week, we believe it will take more than just a mild decline to work off those conditions,” Matt Maley, chief market strategist at Miller Tabak, said in a note on Sunday. “Therefore, we still believe a correction of more than 10% is probable.”
While that may be correct, it will be interesting to see where the Fed’s pain threshold lies which, once reached, may cause the Central Bank to flood the markets with liquidity and prop equities back up. After all, looking at this chart, it’s a long way down to correlation.
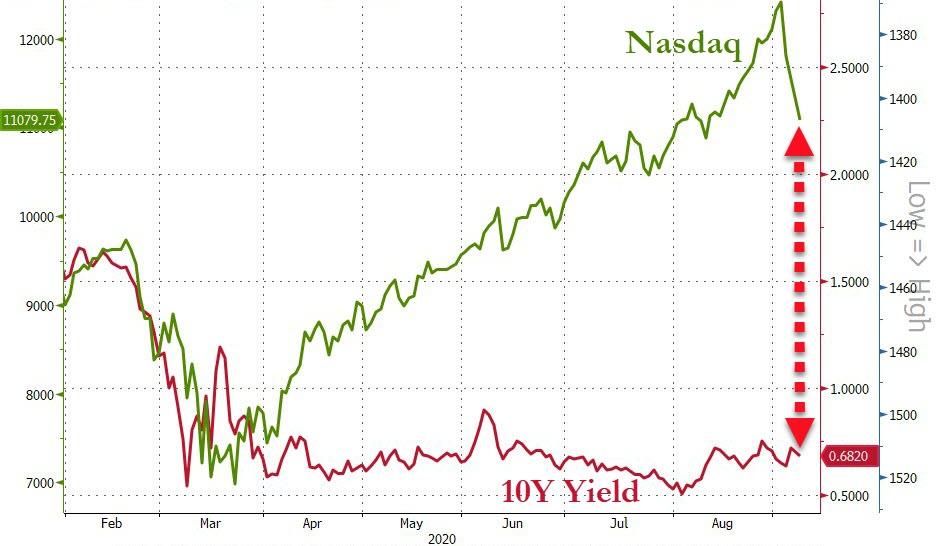
Spot Gold was offsetting the down draft very well, but the GLD ETF was not able to remain in the green but only surrendered a modest -0.18%.
Again, our exit strategy is defined and in place, as we move deeper into the notoriously volatile and unpredictable market period of September and October.
2. ETFs in the Spotlight
In case you missed the announcement and description of this section, you can read it here again.
It features some of the 10 broadly diversified domestic and sector ETFs from my HighVolume list as posted every Saturday. Furthermore, they are screened for the lowest MaxDD% number meaning they have been showing better resistance to temporary sell offs than all others over the past year.
The below table simply demonstrates the magnitude with which these ETFs are fluctuating above or below their respective individual trend lines (%+/-M/A). A break below, represented by a negative number, shows weakness, while a break above, represented by a positive percentage, shows strength.
For hundreds of ETF choices, be sure to reference Thursday’s StatSheet.
For this current domestic “Buy” cycle, here’s how some our candidates have fared:
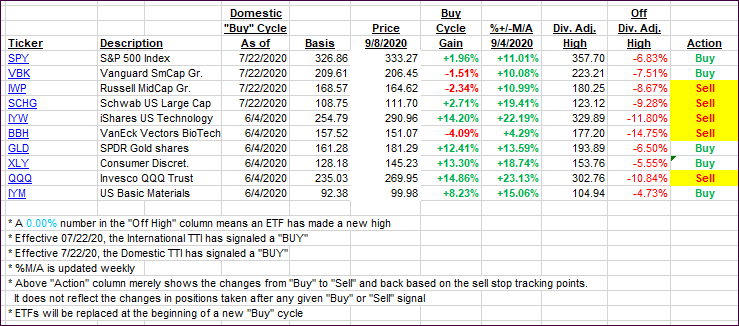
Click image to enlarge
Again, the %+/-M/A column above shows the position of the various ETFs in relation to their respective long-term trend lines, while the trailing sell stops are being tracked in the “Off High” column. The “Action” column will signal a “Sell” once the -8% point has been taken out in the “Off High” column. For more volatile sector ETFs, the trigger point is -10%.
3. Trend Tracking Indexes (TTIs)
Our TTIs plunged as the sell-off continued.
This is how we closed 09/08/2020:
Domestic TTI: +5.29% above its M/A (prior close +7.52%)—Buy signal effective 07/22/2020
International TTI: +4.10% above its M/A (prior close +5.45%)—Buy signal effective 07/22/2020
Disclosure: I am obliged to inform you that I, as well as my advisory clients, own some of the ETFs listed in the above table. Furthermore, they do not represent a specific investment recommendation for you, they merely show which ETFs from the universe I track are falling within the specified guidelines.
Contact Ulli