
- Moving the markets
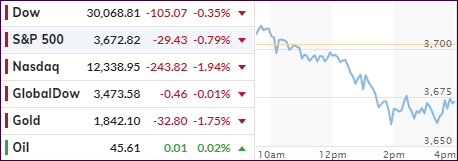
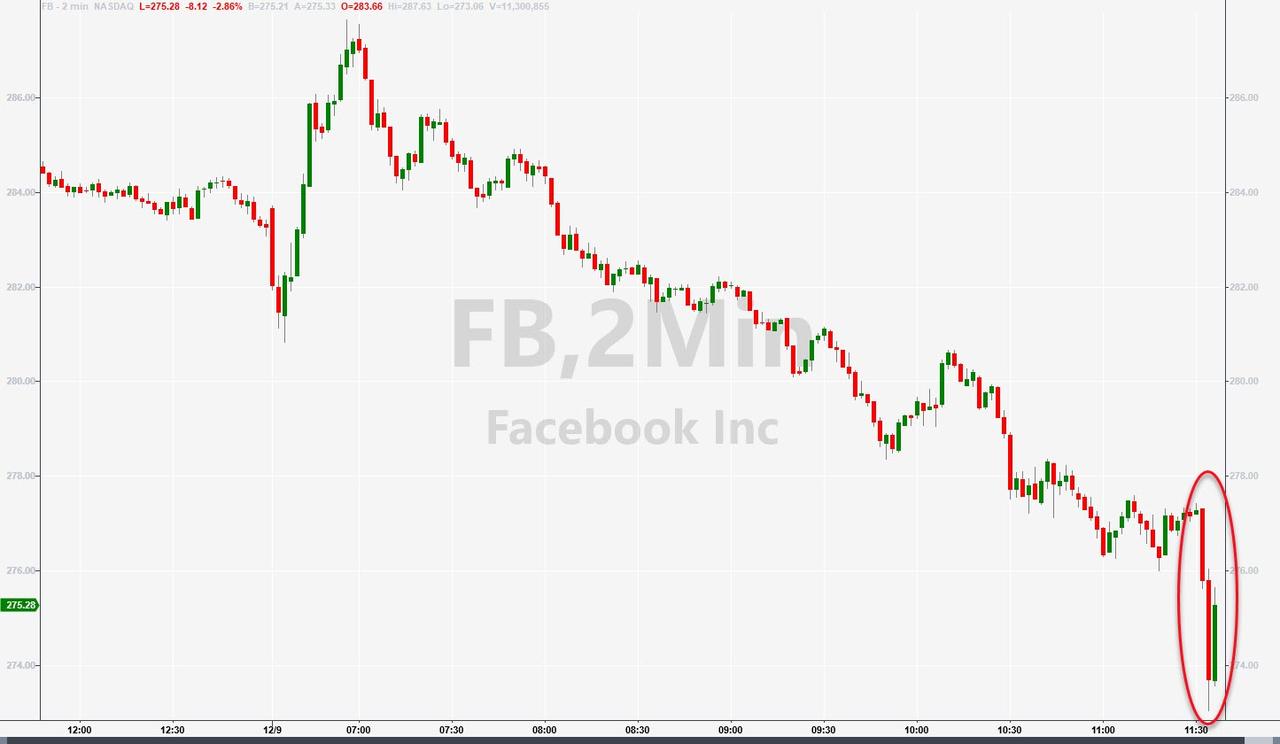
An early bounce in the markets disappeared in a hurry with tech shares struggling in part due to the Federal Trade Commission and state attorneys general led by New York filing an antitrust complaint against Facebook. The allegations include stifling of competition to protect its monopoly power.
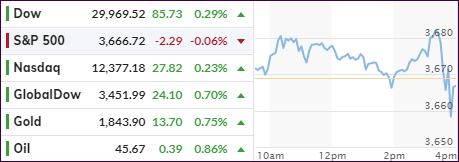
That announcement took down the tech sector the most, with the Nasdaq surrendering almost 2%, but the other two major indexes stumbled as well. However, given the fact that we were hovering in record territory, today’s pullback was modest and in line of what you might expect after scoring all-time highs.
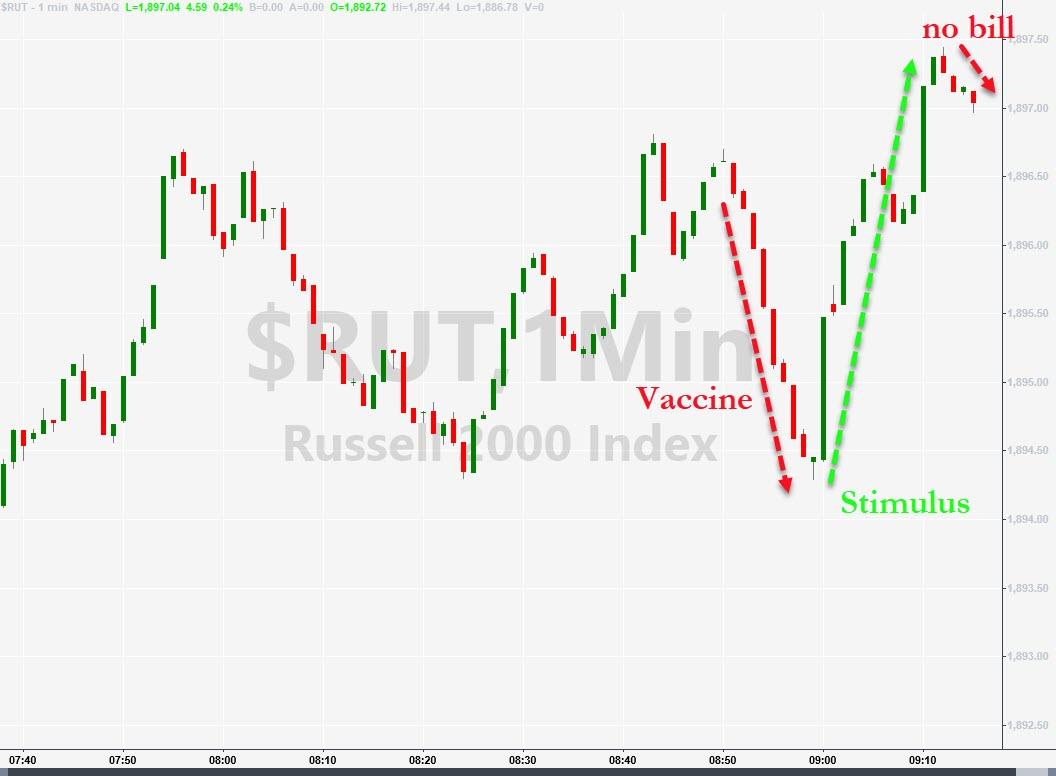
“I think we’re having a bit of a digestion day after hitting new highs,” said Keith Lerner, chief market strategist at Truist. “There’s some hesitation because of the stimulus talks, but leadership still shows the market is leaning toward something happening” on that front. Lerner pointed out that small-cap stocks weren’t down as much as the large-cap indexes.
Of course, the battle over the relief bill went on full force and took the starch out of the early levitation, after McConnell slammed Schumer over the relief package rejection.
ZH summed up the tit for tat like this:
*MCCONNELL SAYS DEMOCRATS MOVING GOALPOSTS ON AID BILL
*MCCONNELL SAYS SCHUMER, PELOSI BRUSHING OFF GOP AID PROPOSALS
*MCCONNELL SAYS DEMOCRATS NEED TO DECIDE TO MAKE LEGISLATION
FANG stocks got hammered with JP Morgan analyst Ryan Brinkman not helping matters when opining that those shares were “drastically” overvalued.
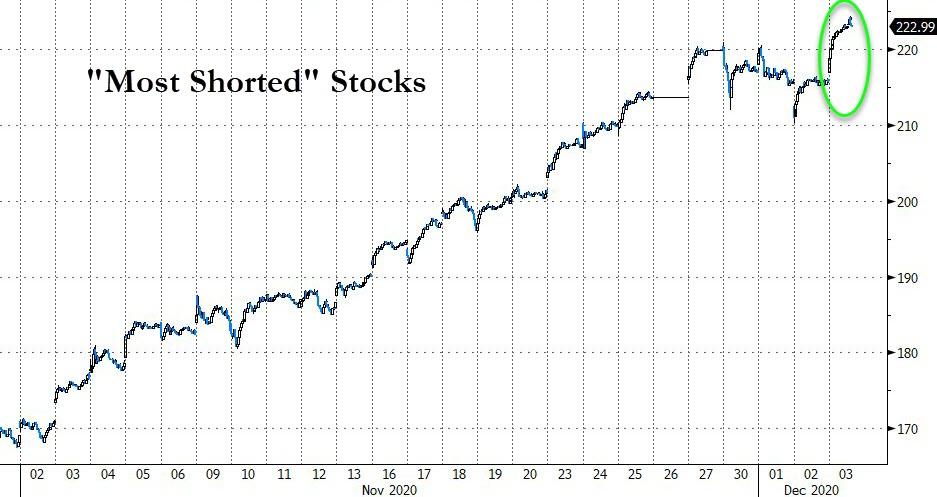
The usual support from the well-documented short squeezes was conspicuously absent when that sector suffered its biggest loss since the end of October.
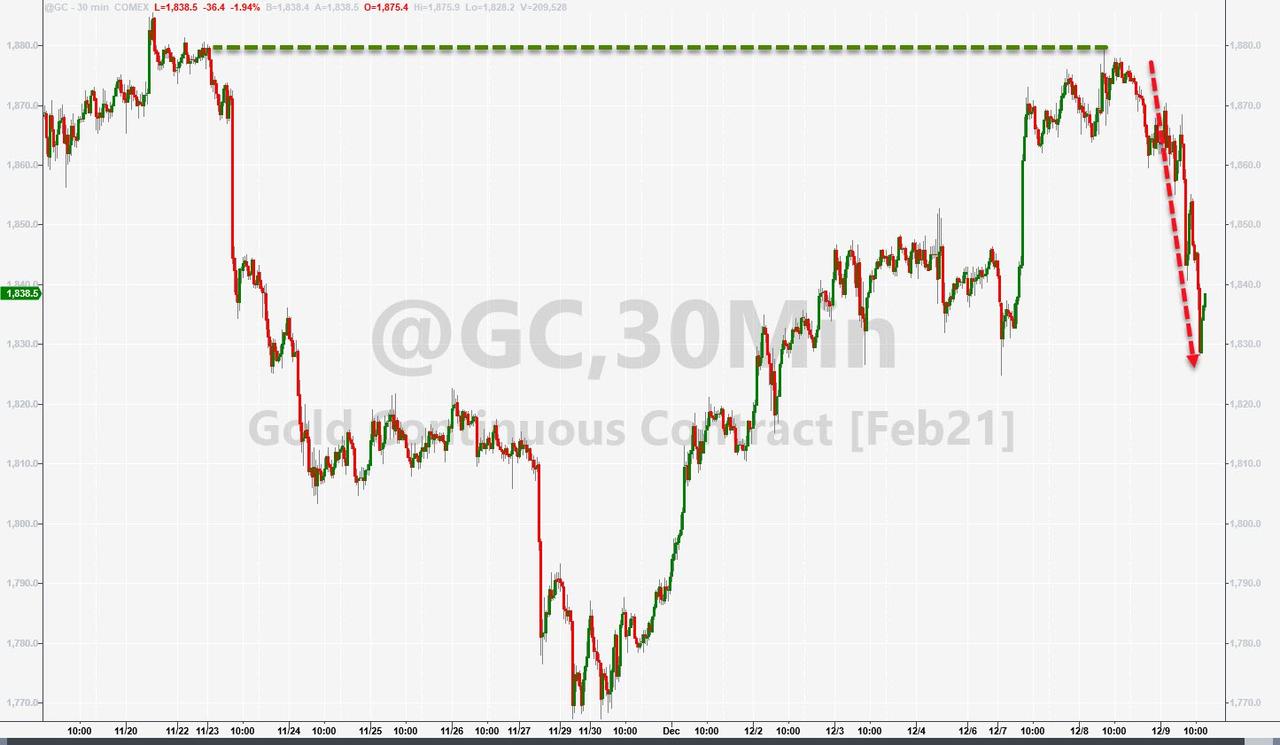
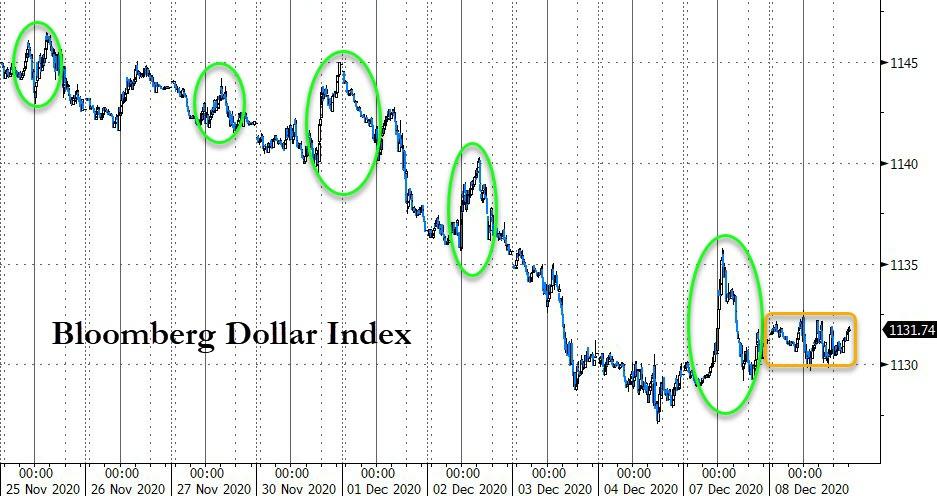
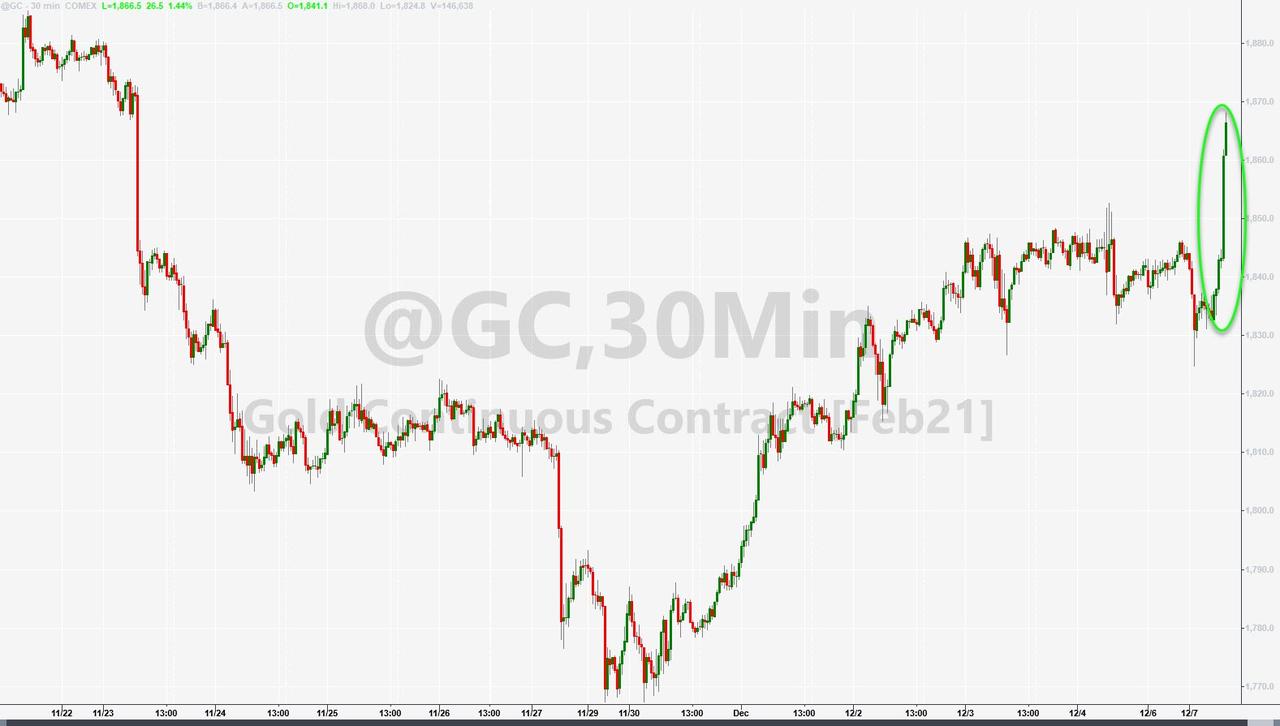
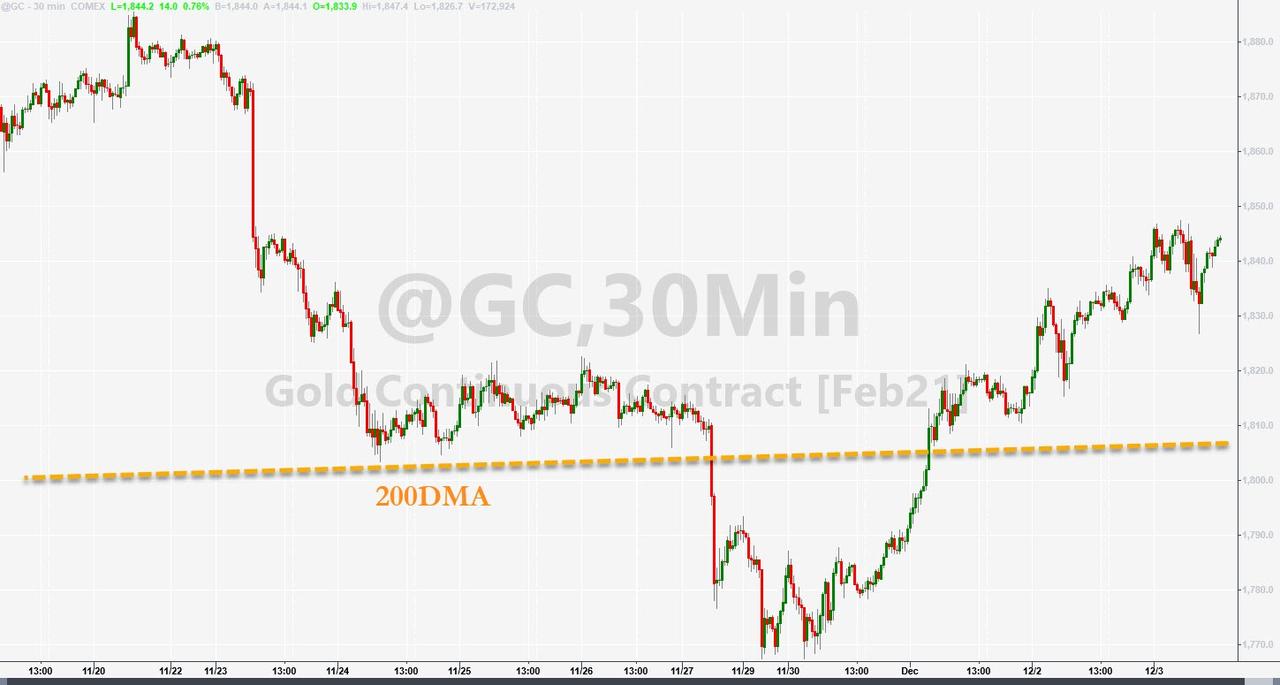
The US Dollar did a turnaround and spiked higher thereby putting the pressure on gold with the precious metal giving back its hard-fought gains of the recent past.
With equities being sold, you would have expected bonds to rally, but that did not happen; yields rose pulling down bond prices.
In the end, it was just of those days where there was simply no place to hide.
Read More

