No Place To Hide

Ulli Market Commentary Contact

[Chart courtesy of MarketWatch.com]

  1. Moving the markets

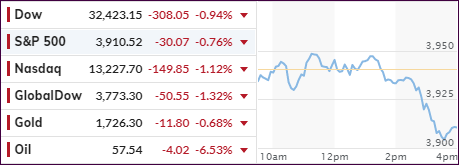
An early attempt by the major indexes to cling to their respective unchanged lines proved to be a futile one, when mid-day the bears stormed out of hibernation. All equities were slammed, and a sea of red was the inevitable result.

Even slipping bond yields could not stem the tide, but at least the 20-year Bond ETF (TLT) finally managed a green close after having endured a serious slapping for most of this year (-13.61%).

One of the reasons for this equity weakness was the sudden scare of a third pandemic wave, which may impact the population in terms of medical vulnerability. Not helping matters was the realization that the much-touted global economic recovery may find itself between a rock and a hard place.

Added CNBC:

The World Health Organization said most regions of the globe are seeing an increase in new Covid cases as highly contagious variants continue to spread. Germany is extending its lockdown until April 18, while nearly a third of France entered a month-long shutdown on Saturday. Oil prices fell more than 6% amid the threat of a third wave of global infections.

To me, it seems that the bullish theme has fumbled somewhat over the past week, despite the Fed’s reckless money printing efforts during which $100 billion were created.

Today, there was simply no place to hide, as growth-, value- and SmallCap sectors were all pulled out of the barn for a severe spanking. For sure, some new driving force is needed to pull equities out of the doldrums.

Hmm, I wonder what that could be given that even today’s joint jawboning session between Fed head Powell and Treasury Secretary Yellen did nothing but accelerate downside momentum. Ouch!

Read More
Tech Fights Back

Ulli Market Commentary Contact

[Chart courtesy of MarketWatch.com]

  1. Moving the markets

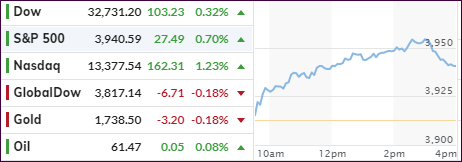
After getting pulled off its lofty level last week, the tech sector showed signs of life and built on Friday’s modest rebound by gaining +1.23% for the day. While all three major indexes ended in the green, today’s rotation was from “value” into “big-tech growth,” thereby leaving SmallCaps in the dust.

ZH equated it to a “panic rotation,” as this graph shows, apparently caused by a modest drop in bond yields, making this look like more of a relief really and not necessarily the beginning of a new trend.

However, when looking at this Nasdaq 100/Russell 2000 chart, it becomes clear that we have reach a resistance level, which means the Nasdaq could plunge again with SmallCaps subsequently benefiting.

One of my client’s observation this morning, that we appear to be in a meat grinder, is spot on, as an encouraging trend in one asset class ran out of steam with another one picking up the baton, but only on a short-term basis.

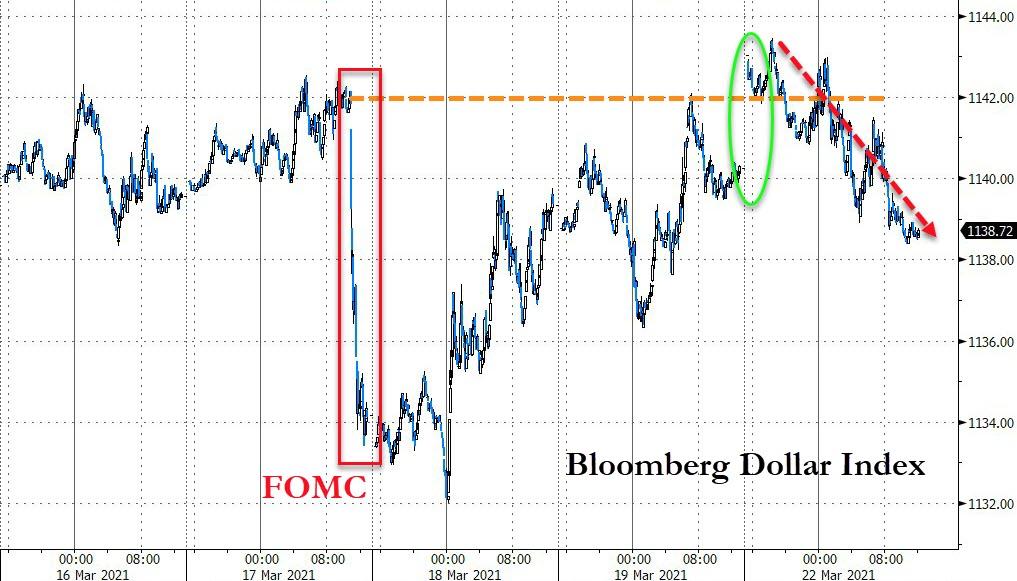
The 10-year bond yield dropped back below the 1.7% level helping equities to a green close, but the late USA Dollar dump, after an early pump, did nothing to support gold with GLD giving back a scant -0.15%.

Read More

ETFs On The Cutline – Updated Through 03/19/2021

Ulli ETFs on the Cutline Contact

Below, please find the latest High-Volume ETF Cutline report, which shows how far above or below their respective long-term trend lines (39-week SMA) my currently tracked ETFs are positioned.

This report covers the HV ETF Master List from Thursday’s StatSheet and includes 312 High Volume ETFs, defined as those with an average daily volume of more than $5 million, of which currently 249 (last week 250) are hovering in bullish territory. The yellow line separates those ETFs that are positioned above their trend line (%M/A) from those that have dropped below it.

Take a look:                                                                   

The HV ETF Master Cutline Report

In case you are not familiar with some of the terminology used in the reports, please read the Glossary of Terms.

If you missed the original post about the Cutline approach, you can read it here.               

ETF Tracker Newsletter For March 19, 2021

Ulli ETF Tracker Contact

ETF Tracker StatSheet          

You can view the latest version here.

[Chart courtesy of MarketWatch.com]

  1. Moving the markets

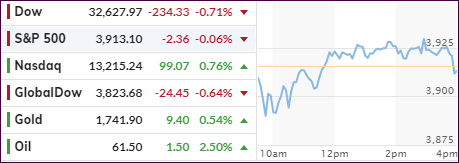
Though the quad withing hour increased today’s volatility, it was what the Fed did not do that added to with the banking sector’s sell-off mode after two days of gains.

The Fed decided not to extend “a pandemic-era capital break” for banks, also referred to as SLR (Supplementary Leverage Ratio) that stoked a rise in bond yields yet created bearishness in financial assets.

Explained CNBC:

The central bank on Friday declined to extend a rule expiring at the end of the month that relaxed the supplementary leverage ratio for banks during the pandemic. The rule allowing banks to hold less capital against Treasuries and other holdings was implemented to calm the bond market during the crisis and encourage banks to lend.

The decision could have some adverse effects, traders have warned, if in response banks sell some of their Treasury holdings. That could send yields even higher at a time when a rapid rise in rates is already unnerving investors.

In other words, fears increased that yields might edge higher merely as an unintended consequence and continue a trend that eventual will make stocks look less attractive. Keep in mind that the 10-year bond yield started 2021 below 1% and has catapulted to the current 1.72%.

The major indexes struggled throughout the week but are down by only moderate amounts with the Dow losing -0.3%, while the S&P 500 and Nasdaq dropped -0.9% and -1.3% respectively.

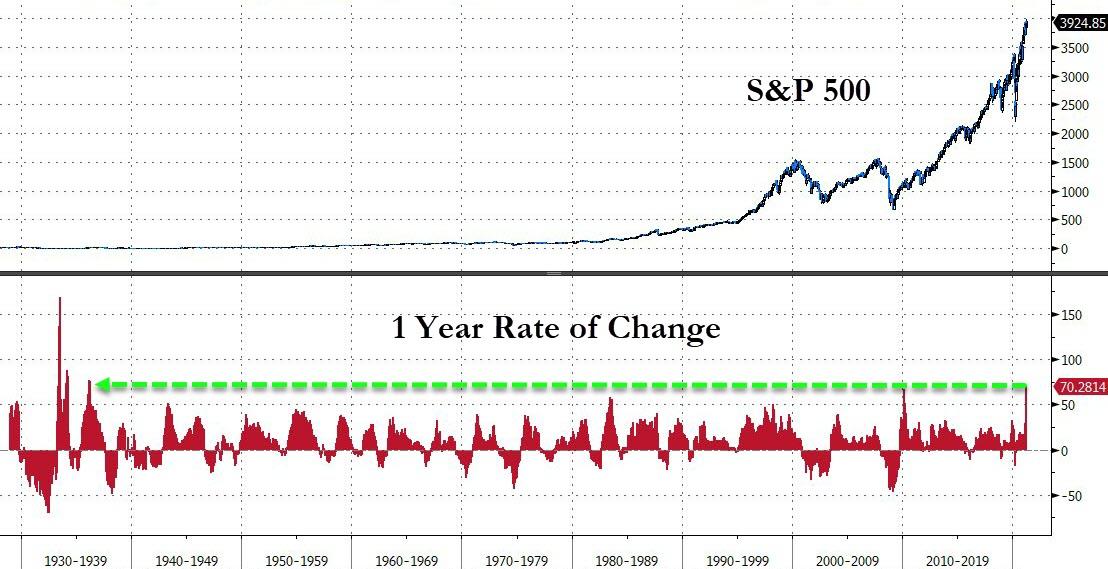
Looking at the big picture, ZH points out that we have just witnessed the greatest 12 month rally in the S&P 500 since the 1930s. And all it took was $13 trillion in global liquidity injections.

So, this was the short-term result. However, what will be the long-term consequences of creating such a vast amount of money out of nowhere?

Read More

Weekly StatSheet For The ETF Tracker Newsletter – Updated Through 03/18/2021

Ulli ETF StatSheet Contact

ETF Data updated through Thursday, March 18, 2021

Methodology/Use of this StatSheet:

1. From the universe of over 1,800 ETFs, I have selected only those with a trading volume of over $5 million per day (HV ETFs), so that liquidity and a small bid/ask spread are assured.

2. Trend Tracking Indexes (TTIs)

Buy or Sell decisions for Domestic and International ETFs (section 1 and 2), are made based on the respective TTI and its position either above or below its long-term M/A (Moving Average). A crossing of the trend line from below accompanied by some staying power above constitutes a “Buy” signal. Conversely, a clear break below the line constitutes a “Sell” signal. Additionally, I use an 8% trailing stop loss on all positions in these categories to control downside risk.

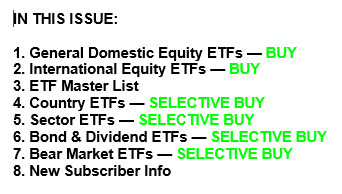
3. All other investment arenas do not have a TTI and should be traded based on the position of the individual ETF relative to its own respective trend line (%M/A). That’s why those signals are referred to as a “Selective Buy.” In other words, if an ETF crosses its own trendline to the upside, a “Buy” signal is generated. Since these areas tend to be more volatile, I recommend a wider trailing sell stop of 8%-10% depending on your risk tolerance.

If you are unfamiliar with some of the terminology, please see Glossary of Terms and new subscriber information in section 9.     

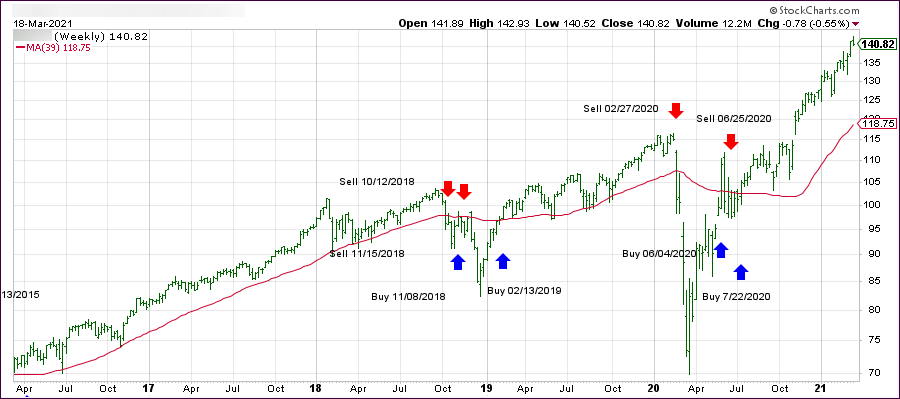
1. DOMESTIC EQUITY ETFs: BUY — since 07/22/2020

Click on chart to enlarge

Our main directional indicator, the Domestic Trend Tracking Index (TTI-green line in the above chart) has now rallied above its long-term trend line (red) by +19.59% and remains in “BUY” mode as posted.

Read More

Cranking Yields = Tanking Nasdaq

Ulli Market Commentary Contact

[Chart courtesy of MarketWatch.com]

  1. Moving the markets

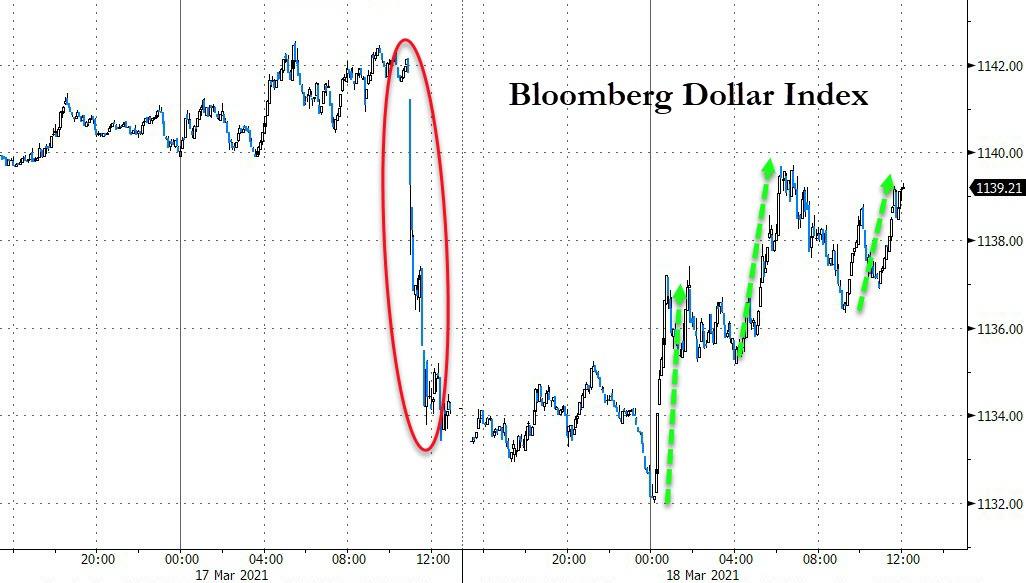
Well, that did not last very long. Even though the Fed’s most dovish words yesterday were able to soothe markets and produce a bounce back from early losses, today was a different day.

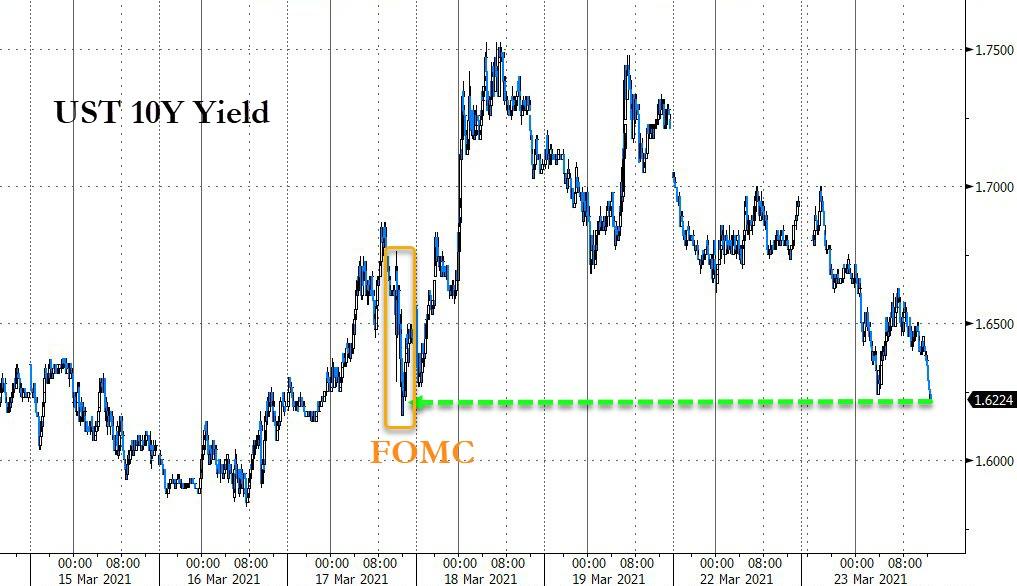
Bond yields suddenly surged, up 11 basis points intraday to 1.75% for the 10-year, but they came off that high to close up +7.5 basis points. Confusion reigned in the markets, and traders and investors alike scrambled to grasp where that volatility came from.

Added MarketWatch:

By confirming the Fed’s willingness to stand pat, even if inflation saw a temporary surge beyond 2%, investors may be raising the probability the economy will run hot in the next few years without having to worry about the central bank pulling away the market’s punchbowl. In that scenario, long-term bond yields would have little protection against the risk of an inflationary surge.

And that sums it up perfectly. Inflation at current levels is far higher than what the Fed admits and any considerable improvement in the economy will only add to that worry, the fear of which is now apparently reflected in the pricing of bond yields.

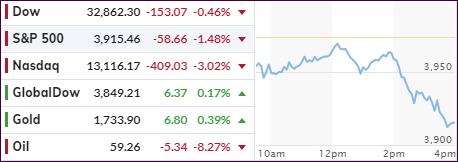
Tech shares got hammered with the Nasdaq plunging -3% with only the financial sector (XLF) closing higher by +0.52%. The S&P 500 tumbled a more moderate -1.48% and the Dow fared the best, down only -0.46%.

Economic data were mixed at best with weekly jobless claims at 770k turning in another poor number compared to expectations of 700k. Looking at the bigger picture, it means that over 18 million Americans are still dependent on government jobless benefits, a number that has not changed materially for four months, according to ZH.

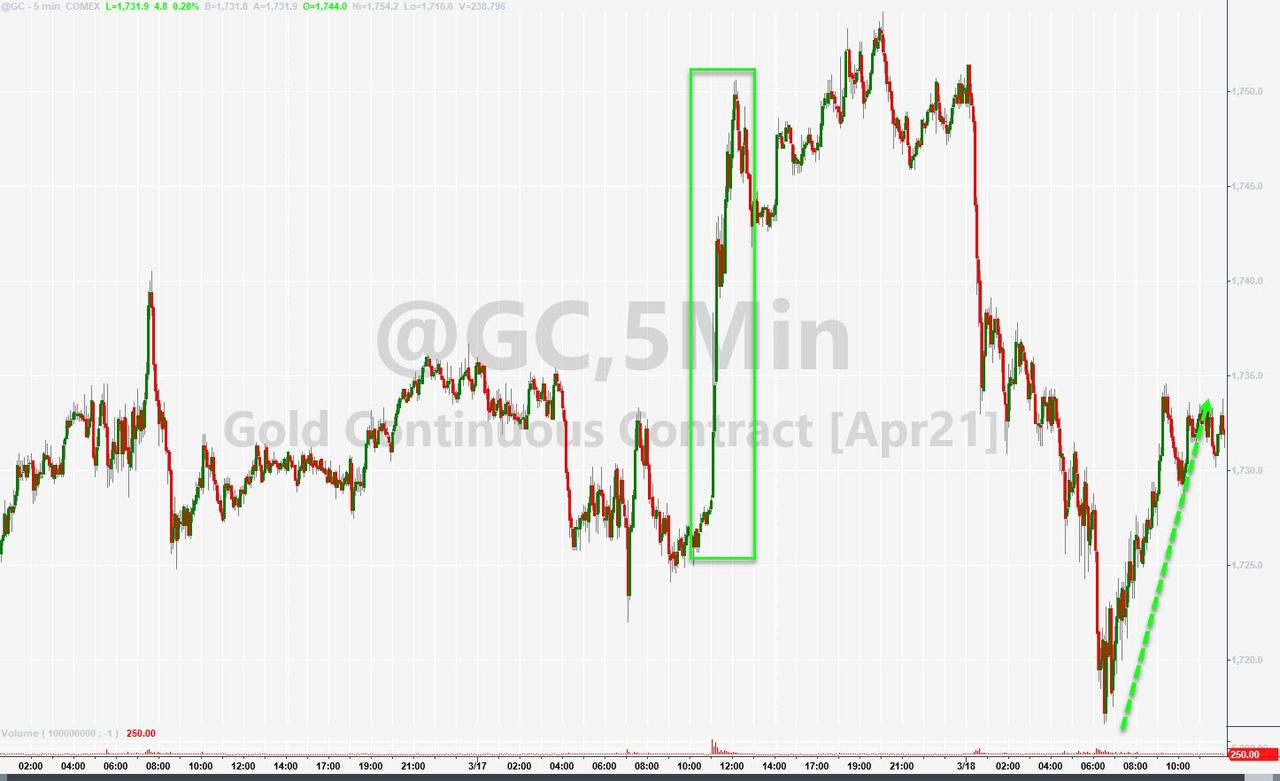
The US Dollar index recovered from yesterday’s drop and headed higher, but spot gold managed to hang on to early gains, yet the gold ETF GLD ended in the red.

Tomorrow, we may see another kick up in volatility, as another market event is on deck, namely the quad-witch (quadruple expiration), when we get the simultaneous expiration of stock index options, market index options, individual stock company options and single-stock futures.

Read More