
- Moving the markets
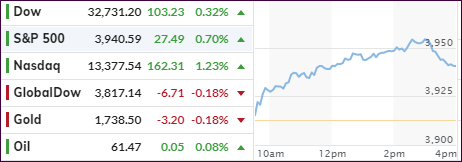
After getting pulled off its lofty level last week, the tech sector showed signs of life and built on Friday’s modest rebound by gaining +1.23% for the day. While all three major indexes ended in the green, today’s rotation was from “value” into “big-tech growth,” thereby leaving SmallCaps in the dust.
ZH equated it to a “panic rotation,” as this graph shows, apparently caused by a modest drop in bond yields, making this look like more of a relief really and not necessarily the beginning of a new trend.
However, when looking at this Nasdaq 100/Russell 2000 chart, it becomes clear that we have reach a resistance level, which means the Nasdaq could plunge again with SmallCaps subsequently benefiting.
One of my client’s observation this morning, that we appear to be in a meat grinder, is spot on, as an encouraging trend in one asset class ran out of steam with another one picking up the baton, but only on a short-term basis.
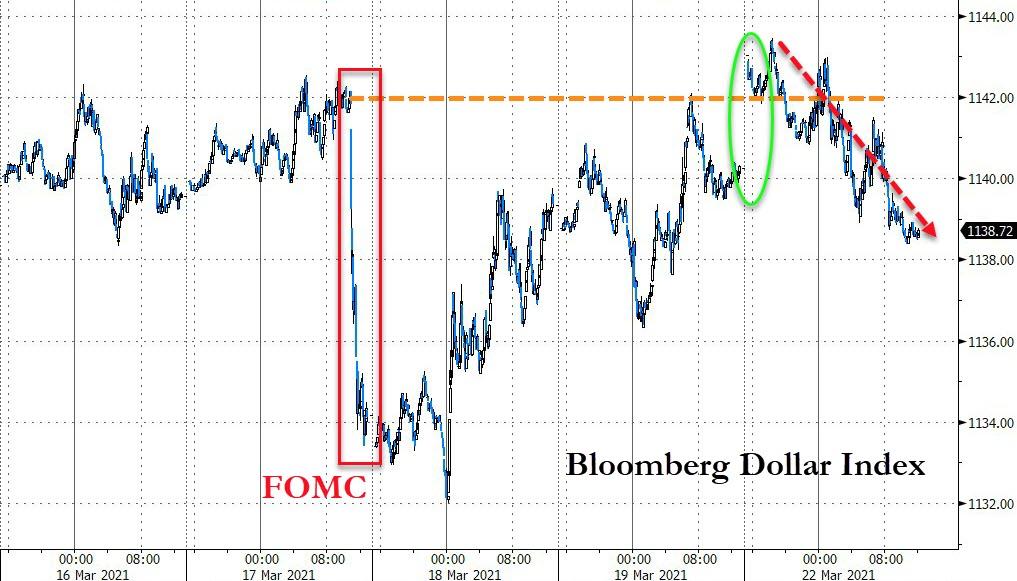
The 10-year bond yield dropped back below the 1.7% level helping equities to a green close, but the late USA Dollar dump, after an early pump, did nothing to support gold with GLD giving back a scant -0.15%.
2. ETFs in the Spotlight
In case you missed the announcement and description of this section, you can read it here again.
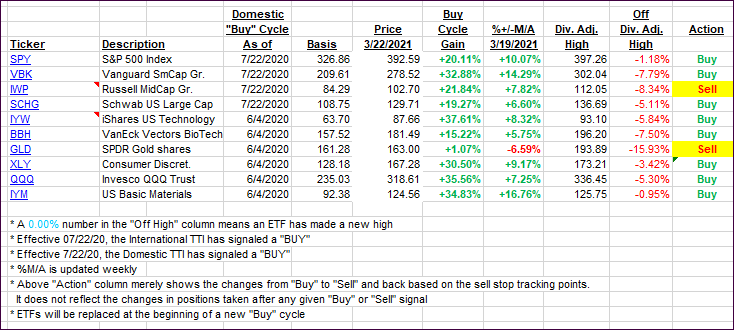
It features some of the 10 broadly diversified domestic and sector ETFs from my HighVolume list as posted every Saturday. Furthermore, they are screened for the lowest MaxDD% number meaning they have been showing better resistance to temporary sell offs than all others over the past year.
The below table simply demonstrates the magnitude with which these ETFs are fluctuating above or below their respective individual trend lines (%+/-M/A). A break below, represented by a negative number, shows weakness, while a break above, represented by a positive percentage, shows strength.
For hundreds of ETF choices, be sure to reference Thursday’s StatSheet.
For this current domestic “Buy” cycle, here’s how some our candidates have fared:
Click image to enlarge.
Again, the %+/-M/A column above shows the position of the various ETFs in relation to their respective long-term trend lines, while the trailing sell stops are being tracked in the “Off High” column. The “Action” column will signal a “Sell” once the -8% point has been taken out in the “Off High” column. For more volatile sector ETFs, the trigger point is -10%.
3. Trend Tracking Indexes (TTIs)
Our TTIs skidded a tad as today’s gains were not broad based.
This is how we closed 3/22/2021:
Domestic TTI: +17.99% above its M/A (prior close +18.38%)—Buy signal effective 07/22/2020.
International TTI: +16.85% above its M/A (prior close +17.05%)—Buy signals effective 07/22/2020.
Disclosure: I am obliged to inform you that I, as well as my advisory clients, own some of the ETFs listed in the above table. Furthermore, they do not represent a specific investment recommendation for you, they merely show which ETFs from the universe I track are falling within the specified guidelines.
Contact Ulli