
- Moving the markets
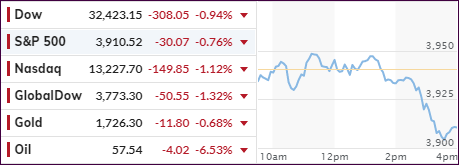
An early attempt by the major indexes to cling to their respective unchanged lines proved to be a futile one, when mid-day the bears stormed out of hibernation. All equities were slammed, and a sea of red was the inevitable result.
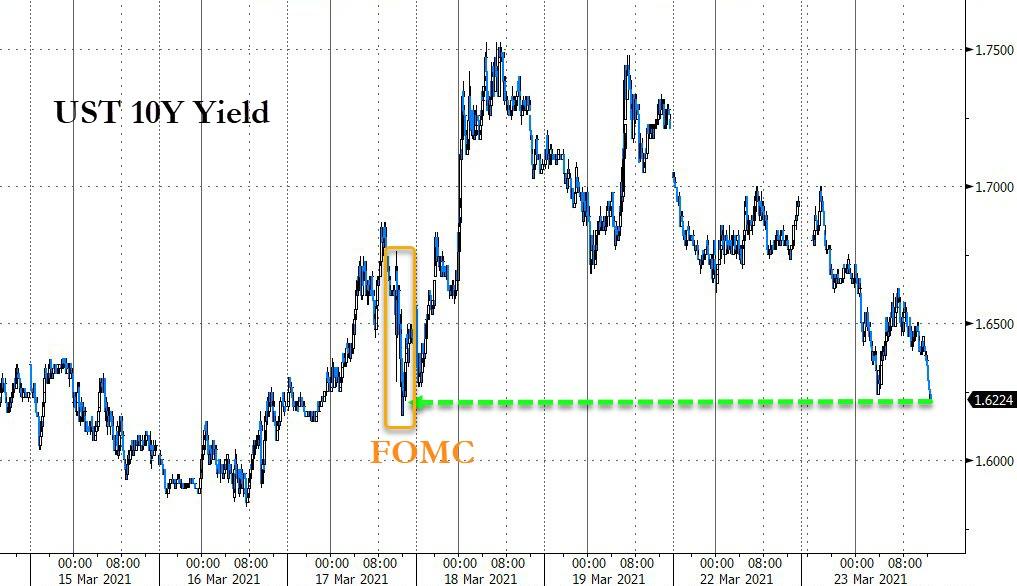
Even slipping bond yields could not stem the tide, but at least the 20-year Bond ETF (TLT) finally managed a green close after having endured a serious slapping for most of this year (-13.61%).
One of the reasons for this equity weakness was the sudden scare of a third pandemic wave, which may impact the population in terms of medical vulnerability. Not helping matters was the realization that the much-touted global economic recovery may find itself between a rock and a hard place.
Added CNBC:
The World Health Organization said most regions of the globe are seeing an increase in new Covid cases as highly contagious variants continue to spread. Germany is extending its lockdown until April 18, while nearly a third of France entered a month-long shutdown on Saturday. Oil prices fell more than 6% amid the threat of a third wave of global infections.
To me, it seems that the bullish theme has fumbled somewhat over the past week, despite the Fed’s reckless money printing efforts during which $100 billion were created.
Today, there was simply no place to hide, as growth-, value- and SmallCap sectors were all pulled out of the barn for a severe spanking. For sure, some new driving force is needed to pull equities out of the doldrums.
Hmm, I wonder what that could be given that even today’s joint jawboning session between Fed head Powell and Treasury Secretary Yellen did nothing but accelerate downside momentum. Ouch!
2. ETFs in the Spotlight
In case you missed the announcement and description of this section, you can read it here again.
It features some of the 10 broadly diversified domestic and sector ETFs from my HighVolume list as posted every Saturday. Furthermore, they are screened for the lowest MaxDD% number meaning they have been showing better resistance to temporary sell offs than all others over the past year.
The below table simply demonstrates the magnitude with which these ETFs are fluctuating above or below their respective individual trend lines (%+/-M/A). A break below, represented by a negative number, shows weakness, while a break above, represented by a positive percentage, shows strength.
For hundreds of ETF choices, be sure to reference Thursday’s StatSheet.
For this current domestic “Buy” cycle, here’s how some our candidates have fared:
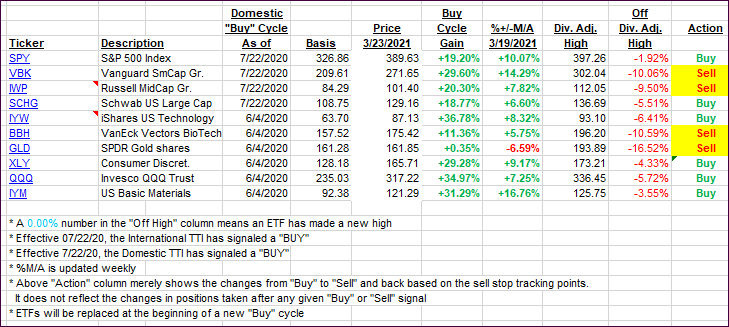
Click image to enlarge.
Again, the %+/-M/A column above shows the position of the various ETFs in relation to their respective long-term trend lines, while the trailing sell stops are being tracked in the “Off High” column. The “Action” column will signal a “Sell” once the -8% point has been taken out in the “Off High” column. For more volatile sector ETFs, the trigger point is -10%.
3. Trend Tracking Indexes (TTIs)
Our TTIs dropped as a sea of red affected the broad market.
This is how we closed 3/23/2021:
Domestic TTI: +16.29% above its M/A (prior close +17.99%)—Buy signal effective 07/22/2020.
International TTI: +15.51% above its M/A (prior close +16.85%)—Buy signals effective 07/22/2020.
Disclosure: I am obliged to inform you that I, as well as my advisory clients, own some of the ETFs listed in the above table. Furthermore, they do not represent a specific investment recommendation for you, they merely show which ETFs from the universe I track are falling within the specified guidelines.
Contact Ulli