Below, please find the latest High-Volume ETF Cutline report, which shows how far above or below their respective long-term trend lines (39-week SMA) my currently tracked ETFs are positioned.
This report covers the HV ETF Master List from Thursday’s StatSheet and includes 312 High Volume ETFs, defined as those with an average daily volume of more than $5 million, of which currently 271 (last week 278) are hovering in bullish territory. The yellow line separates those ETFs that are positioned above their trend line (%M/A) from those that have dropped below it.
In case you are not familiar with some of the terminology used in the reports, please read the Glossary of Terms. If you missed the original post about the Cutline approach, you can read it here.
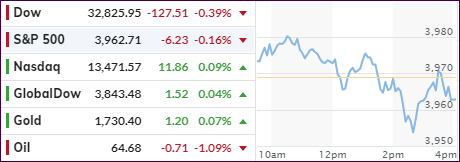
Yesterday, I talked about rising bond yields to be a potential equalizer to future market direction, and we saw some of it today.
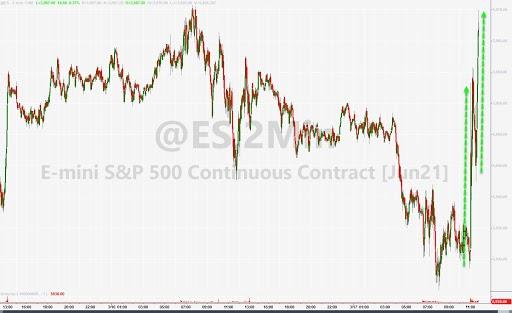
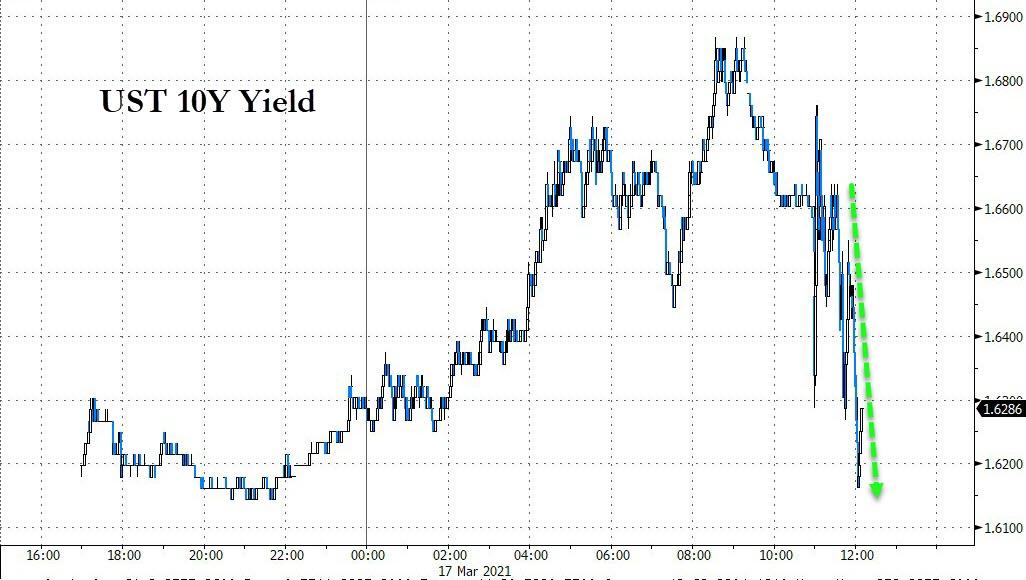
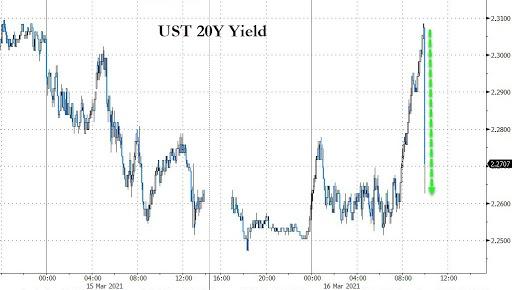
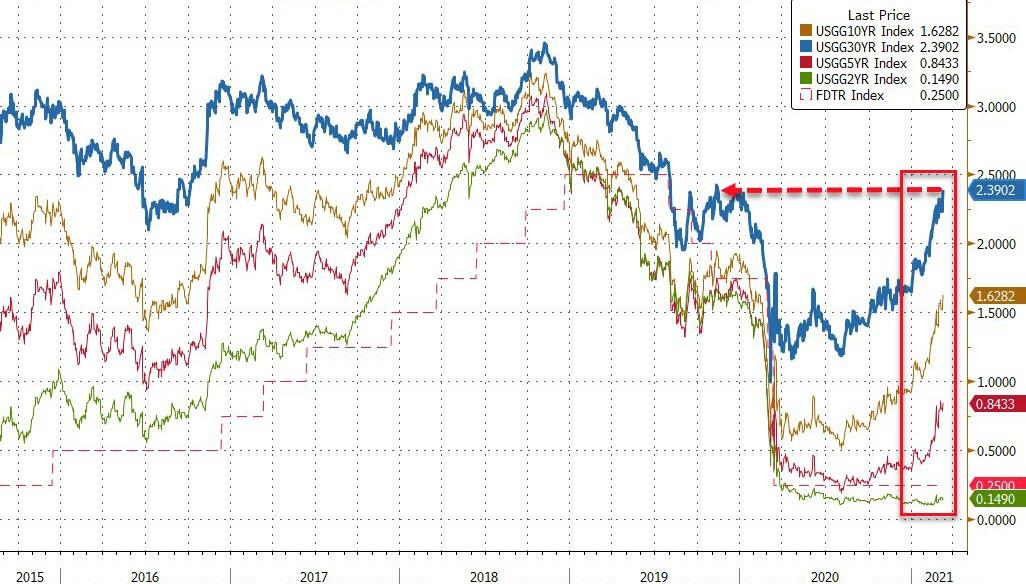
Stocks broke down a couple of times this morning, as the 10-year yield surged twice and pulled the Dow off its lofty level, as Bloomberg points to in this chart:
This is important and ZH elaborated as follows:
As we noted previously, if and when CTAs turn from sellers to outright shorters, accelerating the downward momentum in the 10Y price (and spike in yield), it may turn ugly fast, because as Morgan Stanley explained yesterday, while a slow push higher in the 10Y yield won’t affect risk assets materially, “should that adjustment in rates occur more rapidly, all stock prices will adjust lower, perhaps sharply, rather than just go sideways.”
While that is a future likelihood, at least today, a late afternoon ramp pulled the major indexes out of the red and to a green close. Contributing to this rebound were headlines from Joe Biden’s speech promising these goodies, which represent a fiscal bonanza:
*BIDEN: GAP IN BLACK, LATINO UNEMPLOYMENT IS `MUCH TOO LARGE’
*BIDEN: NEED RELIEF FOR WORKING FAMILIES, BUSINESSES NOW
*BIDEN: WILL LAY OUT FRAMEWORK FOR NEXT RELIEF PACKAGE NEXT WEEK
*BIDEN: VACCINE DISTRIBUTION IS GREATEST OPERATIONAL CHALLENGE
*BIDEN SAYS $600 RELIEF PAYMENTS AREN’T ENOUGH
*BIDEN: HOPE DEMOCRATIC CONGRESS CONTROL LEADS TO MIN WAGE BOOST
*BIDEN: AMERICANS ENTITLED TO $15/HOUR MINIMUM WAGE
*BIDEN: BLACK, BROWN-OWNED BUSINESS HAVE HAD LESS RELIEF ACCESS
*BIDEN: TENS OF THOUSANDS OF COS. GOT RELIEF THEY SHOULDN’T HAVE
*BIDEN: FOCUS TO BE ON SMALL BIZ WITHOUT CONNECTIONS
*BIDEN: WILL DIRECT RELIEF TO THOSE INDUSTRIES HIT THE HARDEST
*BIDEN: WILL HAVE NAVIGATORS TO HELP SMALL BIZ UNDERSTAND RELIEF
*BIDEN: WILL MAKE BANK EXPECTATIONS `CRYSTAL CLEAR’
That was all it took to restore bullish confidence, and up we went. The leader again, was the Nasdaq with a solid +1.03% gain, for a change outperforming Small- and MidCaps.
On the economic front, we learned that December Payrolls missed by a huge margin. It’s hard to believe, but 140,000 jobs were lost on expectations of a 50k gain. This is the worst month since April’s record drop.
You would think that a number like this would have decimated the stock market, but as I have repeatedly pounced on, the economy and stock markets are in no way related.
It’s all about monetary and fiscal stimulus, and with the Fed announcing “no taper” anytime soon, markets appear to be ready to reach for the next all-time high.
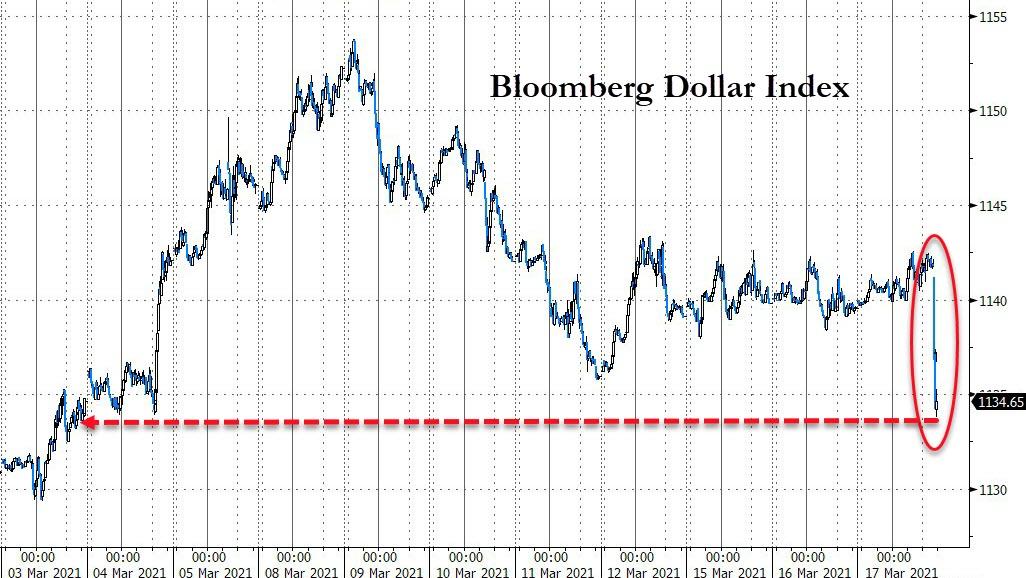
Gold got smacked today, giving back its hard-fought gains from earlier in the week, as the US Dollar rallied on higher bond yields.
Again, bond yields are the pivotal sector to watch, because a continued spike will affect equities negatively at some point.
ETF Data updated through Thursday, January 7, 2021
Methodology/Use of this StatSheet:
1. From the universe of over 1,800 ETFs, I have selected only those with a trading volume of over $5 million per day (HV ETFs), so that liquidity and a small bid/ask spread are assured.
2. Trend Tracking Indexes (TTIs)
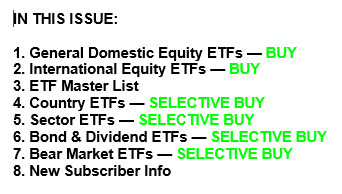
Buy or Sell decisions for Domestic and International ETFs (section 1 and 2), are made based on the respective TTI and its position either above or below its long-term M/A (Moving Average). A crossing of the trend line from below accompanied by some staying power above constitutes a “Buy” signal. Conversely, a clear break below the line constitutes a “Sell” signal. Additionally, I use a 7.5% trailing stop loss on all positions in these categories to control downside risk.
3. All other investment arenas do not have a TTI and should be traded based on the position of the individual ETF relative to its own respective trend line (%M/A). That’s why those signals are referred to as a “Selective Buy.” In other words, if an ETF crosses its own trendline to the upside, a “Buy” signal is generated. Since these areas tend to be more volatile, I recommend a wider trailing sell stop of 7.5% -10% depending on your risk tolerance.
If you are unfamiliar with some of the terminology, please see Glossary of Termsand new subscriber information in section 9.
1. DOMESTIC EQUITY ETFs: BUY— since 07/22/2020
Click on chart to enlarge
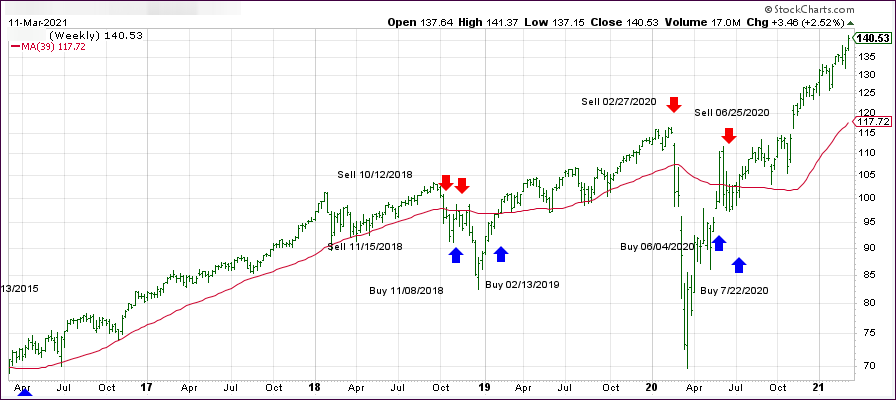
Our main directional indicator, the Domestic Trend Tracking Index (TTI-green line in the above chart) has now rallied above its long-term trend line (red) by +21.46% and remains in “BUY” mode as posted.
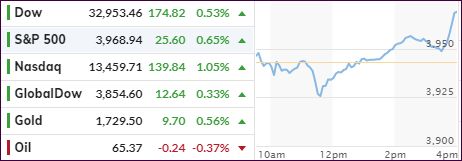
The mood today was up, up, and away with hardly any intra-day corrections. An early jump set the major indexes on track for smooth sailing throughout the session with all of them ending in record territory.
Traders decided that after the roller coaster ride of the past few days, and the political tug-of-war nearing an end, expectations of a massive stimulus program would be a virtual certainty with most of that money finding its way into the markets.
After some soggy recent performance, the Nasdaq took center stage with not only a +2.56% gain but also closing above 13,000 for the first time. Despite that breathtaking advance, MidCaps led the way with +2.81% barely ahead of SmallCaps with +2.61%.
It seems like the worse things get, the more the stock market likes it, which was the title of an article by author Michal Synder, who summed things up like this:
Of course, the bigger news on Wednesday was the utter chaos that we witnessed at the U.S. Capitol in Washington. Doors and windows were smashed, members of Congress had to be evacuated, and protesters freely roamed through the halls and offices. You would think that something like that would definitely send stock prices plunging, but instead the Dow ended the day up 437 points.
Even though we have just come through the worst year in recent memory, and even though our system of government is in disarray, stock prices hit an all-time record high on Wednesday.
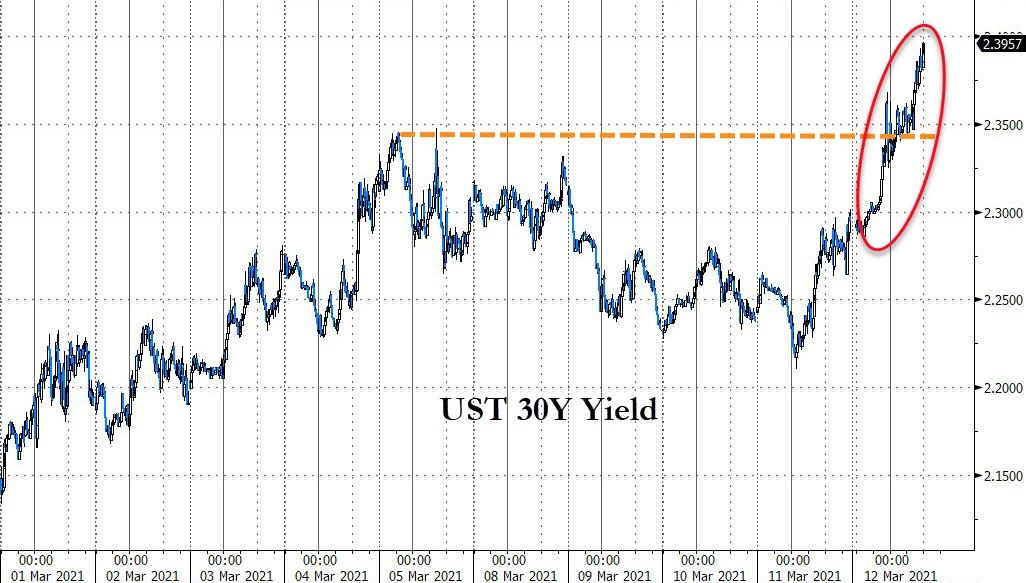
10-year bond yields continued higher and are closing in on their highest spike since March last year, nearing 1.09% intraday, as ZH pointed out. The US Dollar found some life and surged thereby taking any starch out of Gold’s attempt to build on yesterday’s rebound.
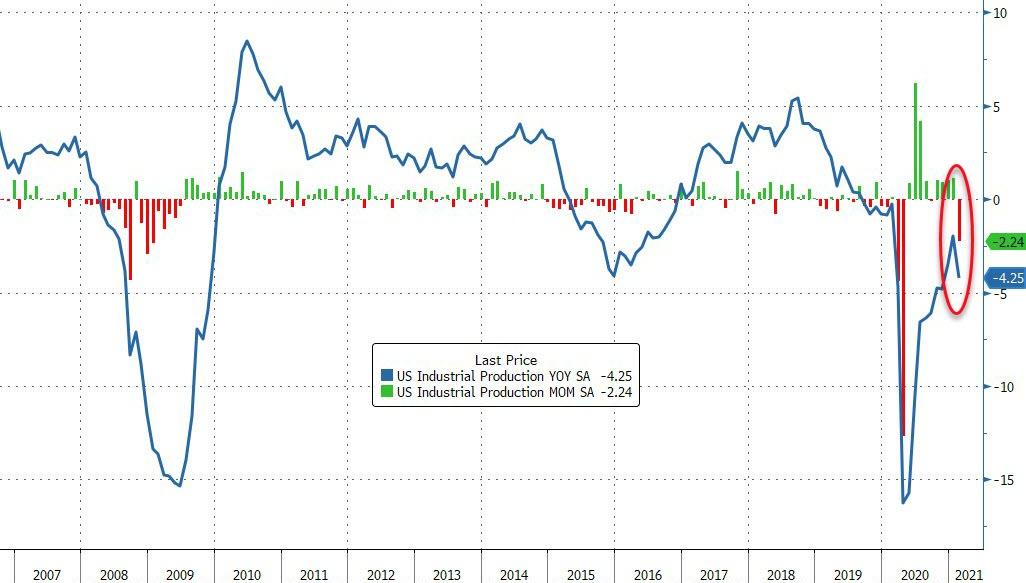
In the end, further advances will be supported by a continued expansion of the Fed’s balance sheet, as Bloomberg points out in this chart. However, the fly in the ointment could be surging bond yields which, if left unchecked, will be the great equalizer.
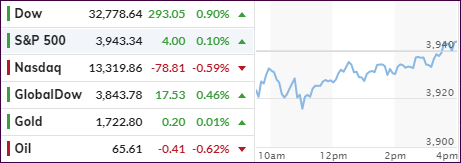
Following the Georgia run-off elections, which are favoring the Democrats, the markets were in a split mode with bond yields and SmallCaps surging, even though the US Dollar and the tech sector were stumbling. Gold did its best imitation of a swan dive and gave up its YTD gains.
It’s widely assumed that, should the Dems take the Senate, tougher tech regulations will be on deck, hurting that sector, with more stimulus in the pipeline affecting the dollar adversely.
Despite the late sell-off, in part caused by protesters storming the Capitol, the Dow held up the best and closed in record territory. Still, the Dow’s +1.44% gain was bested again by SmallCaps, which added +2.88%.
CNBC saw it this way:
Tech stocks — the best-performing market group over the past year — lagged on Wednesday amid concerns over higher tax rates. The prospects of new stimulus also made tech stocks less attractive relative to beaten-down cyclical names.
It’s amazing that the equities overall performed as well as they did with bond yield spiking and the 10-year shooting through the 1% glass ceiling without a problem. For sure, if that trend continues for any length of time, it will affect stocks negatively.
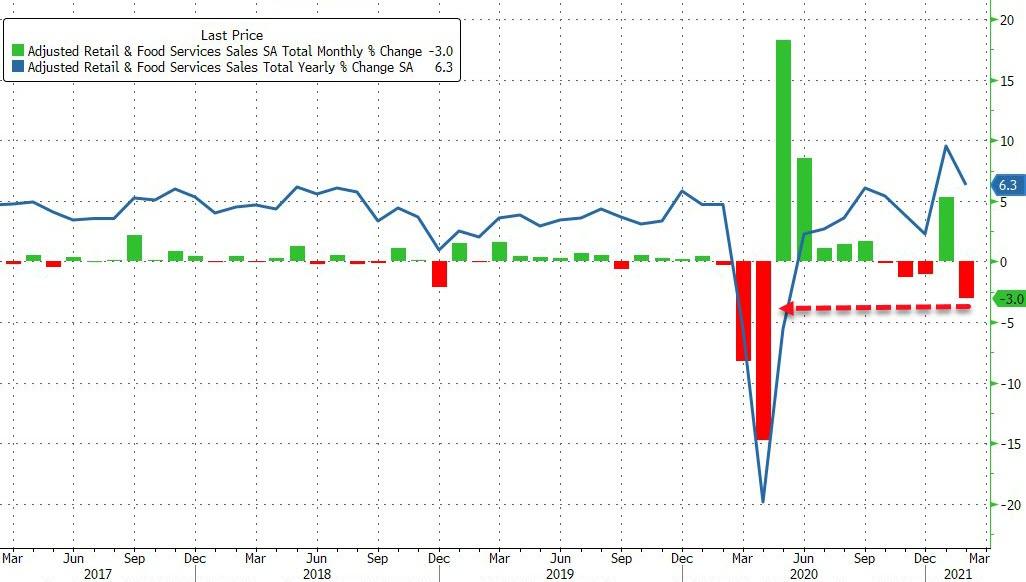
This makes me wonder, if the “Smart Money” indeed is looking a little bit further ahead, which may be why Bloomberg’s chart below has not changed at all:
Even though the futures markets were mired in uncertainty and failed to rebound from Monday’s collapse, it was a different story once the cash markets opened.
The major indexes found some footing, dipped mid-day, but then staged a rebound that ended up in a green close.
As posted yesterday, the looming Georgia runoffs were on everyone’s mind, but for the time being, traders and algos alike decided to gamble on a strong economic recovery and in the process recovered some of yesterday’s losses.
Added CNBC:
Investors also looked ahead to two key elections in Georgia, which will determine whether Republicans can hold on to control in the Senate. Many fear that increased tax rates and more progressive policies could weigh on the market if Democrats gain control of the Senate.
However, such an outcome could create an opportunity for a bigger and faster spending package.
Even though the Nasdaq reigned supreme with a gain of +0.95%, SmallCaps continued with their unrelenting performance by adding +1.25%. On the other hand, Crude Oil stole the spotlight with a jaw dropping advance of +5.04%, its first move above $50 since February.
Bond yields rose but remain stuck in a tight trading range, although the US Dollar pumped and dumped, thereby helping Gold to score its second win in a row and also climbing above the $1,950 level.
For sure, we will some effect on the markets tomorrow whether the Georgia vote counting ends tonight or not.